版权声明:Polarisone https://blog.csdn.net/Polarisone/article/details/89520622
在vue中实现echarts柱状图Y轴渐变色
在vue中实现echarts柱状图渐变色
一:安装
1. 首先需要安装echarts依赖包
npm install echarts -S
2. 或者使用国内的淘宝镜像:
npm install -g cnpm --registry=https://registry.npm.taobao.org
二: 创建图表
全局引入
main.js
// 引入echarts
import echarts from 'echarts'

Vue.prototype.$echarts = echarts
Hello.vue
<div id="myChart" :style="{width: '300px', height: '300px'}"></div>
export default {
data(){
return {}
},
mounted(){
this.myChart() //函数调用
},
methods:{
// 左上角柱状图
myChart(){
let myChart= this.$echarts.init(document.getElementById('myChart'));
myChart.setOption({
title: {
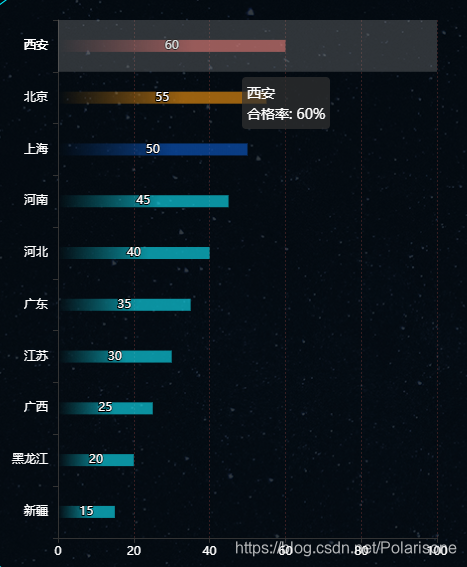
text: '游客来源省份分析',//标题
textStyle: {
color: '#2BFDA3'
},
x:'5%'
},
// 鼠标悬停显示的信息
tooltip: {
// 当tooltip的trigger为‘axis’时,显示多项数据内容数组
trigger: 'axis',
axisPointer: { //默认为直线,可选为:'line' | 'shadow'
type: 'shadow' //阴影
},
formatter: "{b} <br> 合格率: {c}%"
},
// 图例,每个图标最多仅有一个图例
/*legend: {
data: [date]
},*/
// 网格图
grid: {
left: '6%',
right: '6%',
bottom: '2%',
containLabel: true
},
// X轴
xAxis: {
type: 'value',
// 修改柱状图背景网格线颜色
splitLine:{
show: true,
lineStyle: { //X轴网格线型样式
color: "rgba(253,103,96,0.2)",
width: 1,
type: "soild"
}
},
boundaryGap: [0, 0.01],
min: 0, //x轴最小值
max: 100, //x轴最大值
interval: 20,
// 坐标轴的标签
axisLabel: {
formatter: '{value}',
textStyle: {
color: '#fff',
fontWeight: '80'
}
}
},
// Y轴
yAxis: {
type: 'category',
data: ['新疆', '黑龙江', '广西', '江苏', '广东', '河北', '河南','上海','北京','西安'],
axisLabel: {
show: true,
interval: 0,
rotate: 0,
margin: 10,
inside: false,
textStyle: {
color: '#fff',
fontWeight: '50'
}
}
},
// 内容数据
series: [{
type: 'bar', //类型
barWidth : 12,//修改柱状图的宽度
label: { //图形上的文本标签
normal: {
show: true,
// formatter: '{c}',
formatter: function(v) {
var val = v.data;
if (val == 0) {
return '';
}
return val;
}
}
},
// 柱状图形显示的颜色
itemStyle: {
normal: {
//每个柱子的颜色即为colorList数组里的每一项,如果柱子数目多于colorList的长度,则柱子颜色循环使用该数组
color: function(params) {
var index = params.dataIndex;
var colorList = [
// 渐变颜色的色值和透明度
//透明度从0
['rgba(15,235,255,0)','rgba(15,235,255,0)','rgba(15,235,255,0)','rgba(15,235,255,0)','rgba(15,235,255,0)','rgba(15,235,255,0)','rgba(15,235,255,0)','rgba(13,94,208,0)','rgba(255,155,15,0)','rgba(253,103,96,0)'],
//到透明度1 ,如果需要不同的颜色直接修改不同颜色即可
['rgba(15,235,255,0.6)','rgba(15,235,255,0.6)','rgba(15,235,255,0.6)','rgba(15,235,255,0.6)','rgba(15,235,255,0.6)','rgba(15,235,255,0.6)','rgba(15,235,255,0.6)','rgba(13,94,208,0.6)','rgba(255,155,15,0.6)','rgba(253,103,96,0.6)']
];
return {
colorStops: [{
offset: 0, //颜色的开始位置
color: colorList[0][index] // 0% 处的颜色
},{
offset:0.6, //颜色的结束位置
color: colorList[1][index] // 100% 处的颜色
}]
}
}
}
},
data: [ 15, 20, 25, 30, 35,40,45,50,55,60]
}]
})
},
}
}
最终结果