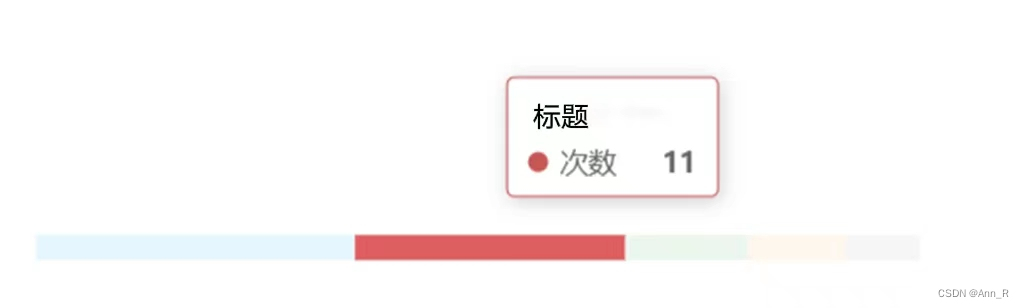
2.效果:

2.使用:
<div ref="echart1" class="echart1"></div>
data() {


  return {


    myEchart1:{

    },
    series1:[],
    dataList:[{

    name:'标题1',num:11},{

    name:'标题2',num:11},{

    name:'标题3',num:11},{

    name:'标题4',num:11},{

    name:'标题5',num:5}],
    colorList: ['#06A4F2', '#CA5657', '#4BA064', '#FAB355', '#9B9B9D'],
  }
},
created() {


	this.getData()
    setTimeout(() => {


      this.drawChart1();
    }, 200)
},
methods:{


	getData(){


	this.dataList.forEach((v, index) => {


        let series = {


          name: v.name,
          type: 'bar',
          stack: 'total',
          emphasis: {


            focus: 'series'
          },
          color: this.colorList[index],
          data: [v.num]
        }
        this.series1.push(series)
      })
	},
    drawChart1() {


    //初始化原因详见:参考2 [问题解决]Echarts:There is a chart instance already initialized on the dom.
      if (this.myEchart1) {

     // 如果不存在,就进行初始化。
        this.myEchart1 = null
      }
      this.myEchart1 = this.$echarts.init(this.$refs.echart1);
      let option = {


        tooltip: {


          trigger: 'axis',
          axisPointer: {


            type: 'shadow' // 'shadow' as default; can also be 'line' or 'shadow'
          }
        },
        grid: {


          left: '3%',
          right: '4%',
          bottom: '3%',
          containLabel: true
        },
        tooltip: {


          confine: false,
        },
        xAxis: {


          //隐藏x轴
          show: false,
        },
        yAxis: {


          //隐藏y轴
          show: false,
          // 均分
          type: "category",
          data: ['次数']
        },
        series: this.series1
      };
      if (this.series1) {


        this.myEchart1.setOption(option);
      }
    },
}
title: {


  text: '单位(元)'
},


xAxis: {


    // show: false,
    type: 'category',
    data: [], //横坐标数组
    axisLabel: {


      // 坐标轴刻度标签的相关设置
      show: true, //控制显隐
      textStyle: {


        fontSize: 12
      },
      // interval: this.echart3Date.length - 2, //间隔显示,步长,控制横坐标显示几个刻度啥的
      Style: {


	      color: '#000', //应该是控制坐标轴刻度标签颜色
	    }
    },
    axisTick: {


      //x轴刻度相关设置
      alignWithLabel: true,
    },
  },

 xAxis: {


  axisTick: {


    show: false,  //隐藏刻度线
  },
  axisLine: {


    lineStyle: {


      fontSize: 12  //刻度线字体大小
    }
  },
  type: 'category',
  data: ['周一', '周二', '周三', '周四', '周五', '周六', '周日']  //横轴数组
},

tooltip : {

      //提示框组件
    trigger: 'axis',
    axisPointer: {


      type: 'cross',
      label: {


        backgroundColor: '#6a7985'
    },
    formatter: '{

    a} <br/>{

    b} : {

    c} <br/>百分比 : {

    d}%' //{a}(系列名称),{b}(数据项名称),{c}(数值), {d}(百分比)
  }
},

series: [  //柱状图
  {


    data: [11,22,33,11,22,33,44,12], //数组
    type: 'bar',
    barWidth: 28, //柱状图宽度
    itemStyle: {


      normal: {


        color: '#59CEF5',  //柱状图颜色
      }
    }
  }
]


series: [  //折线图
   {


     data:[], //数组
     type: 'line',
     smooth: true,
     symbolSize: 0,   //设定圆点的大小
     itemStyle: {


       normal: {


         // color: '#59CEF5', //改变折线点的颜色
         lineStyle: {


           color: '#59CEF5' //改变折线颜色
         },
         // label:{


         //   show: true //显示标注
         // }
       }
     },
     //填充颜色设置
     areaStyle: {


        color: {


          type: "linear",
          x: 0,
          y: 0,
          x2: 0,
          y2: 1,
          colorStops: [
            {


              offset: 0,
              color: "#666EE8" // 0% 处的颜色
            },
            {


              offset: 1,
              color: "#fff" // 100% 处的颜色
            }
          ],
          global: false // 缺省为 false
        }
      }

   }
 ]


legend: {

     //legend 图例位置
  icon: "circle",  //  这个字段控制图例形状  类型包括 circle,rect ,roundRect,triangle,diamond,pin,arrow,none
  orient: 'vertical',
  right: 'right',
  padding: [200, 0, 0, 0]
},

series: [  //饼图
   {


     type: 'pie',
     radius: '60%',
     itemStyle: {


       // borderRadius: 10,
       borderColor: '#fff',
       borderWidth: 0.5
     },
     data: this.echart4Data,
     // data: this.echart4Data.sort(function (a, b) { return a.value - b.value; }), //可排序
     label: {


       normal: {


         show: true,
         // position: 'inner',//显示在扇形上
         textStyle: {


           // color: 'black',  // 改变标示文字的颜色
           fontSize: 12,//文字大小
           fontWeight: 700,
         },
         formatter: '{c}',  //这里注意---标注显示什么,详见提示框组件释义
       }
     }
   }
 ]
参考:
1.echarts设置图标图例legend为圆,长方形,扇形等
2. echarts之饼状图 扇形区域和标示线上显示数据(图标)
3. 第三个绝了!!
详解:当鼠标放上echarts图形时,显示数据、名称,或者自定义tooltip弹窗
4.[问题解决]Echarts:There is a chart instance already initialized on the dom.
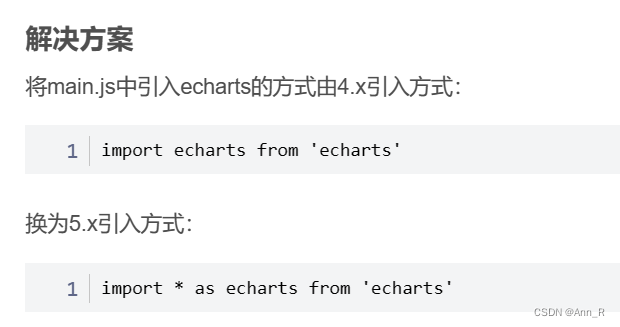
5. vue中使用echarts报错:“TypeError: Cannot read property ‘init‘ of undefined“报错原因及解决方案
参考5怕链接失效,挂一下其中的解决方案