echarts 动态获取数据(柱状图,折线图)

一、html代码

<!--插件 -->
<script src="/coalminehwaui/static/js/project/echartsdemo/js/lib/echarts/echarts.min.js"></script>

<div class="row">
       <!--三级培训和特种作业 -->
        <div id="container1" style=" height: 450%;width: 48%;margin-top: 5%;margin-bottom: 2%"></div>
        <!--综合培训 -->
        <div id="container2" style=" height: 450%;width: 50%;margin-top: 5%;margin-bottom: 2%;margin-left: 2%"></div>
    </div>

二、js代码

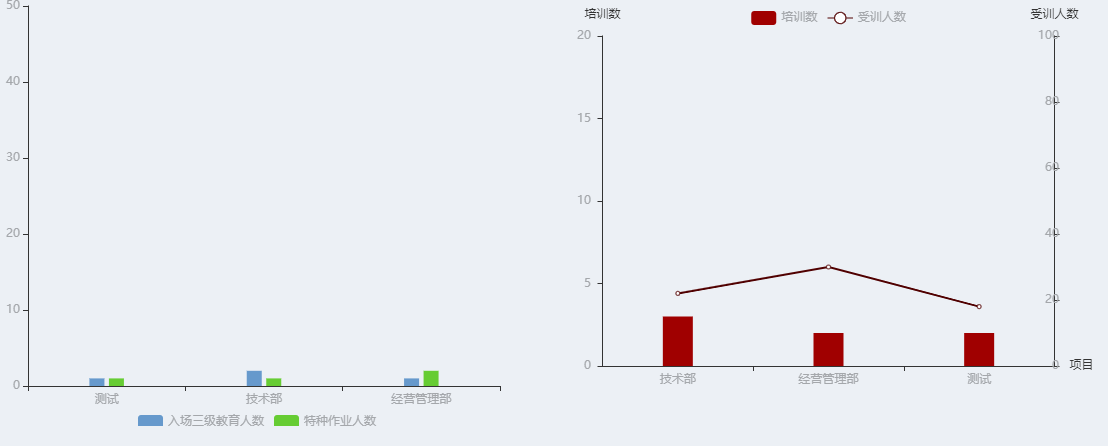
'use strict'

$(function(){// 获取三级培训和特种作业数据
    trainEducationAnalysis.getDepart();
    // 获取综合培训数据
    trainEducationAnalysis.getComprehensiveTrain();
});

var trainEducationAnalysis=new Object({//获取三级教育和特种作业人员数据
    getDepart:function(){
        // 横轴名称
        var arrX=[];
        // 纵轴数据
        var specialY=[];
        // 初级培训
        var primaryY=[];
        $.ajax({
            cache: false,
            type: "post",
            url:backbasePath+'/apia/v1/analysisManager/getDepart',
            dataType:'json',
            data:{
                token:$("#token").val()
            },
            async : false,
            success: function(data) {
                // 返回正常数据
                if('000000' == data.code) {
                    // 后台返回的数据都放在data里面
                    var obj = data.data;
                    for(var i=0;i<obj.length;i++){
                        // 将横轴名称放在数组中
                        arrX.push(obj[i].sysdepartname);
                        // 特殊培训个数
                        specialY.push(obj[i].specialtotal);
                        // 初级培训个数
                        primaryY.push(obj[i].othertotal);
                    }
                    // 根据数据画柱状图
                    trainEducationAnalysis.drawByData(arrX, specialY, primaryY);

                }else{
                    toastr.success("请求数据为空");
                }
            },
            error:function(){
                toastr.success("数据请求失败");
            }
        });
    },

    //获取三级教育和特种作业人员数据
    getComprehensiveTrain:function(){
        // 横轴名称
        var depart=[];
        // 受训人员数据
        var traineeY=[];
        // 培训人员数据
        var trainerY=[];
        $.ajax({
            cache: false,
            type: "post",
            url:backbasePath+'/apia/v1/analysisManager/getComprehensiveTrain',
            dataType:'json',
            data:{
                token:$("#token").val()
            },
            async : false,
            success: function(data) {
                // 返回正常数据
                if('000000' == data.code) {
                    // 后台返回的数据都放在data里面
                    var obj = data.data;
                    for(var i=0;i<obj.length;i++){
                        // 将横轴名称放在数组中
                        depart.push(obj[i].sysdepartname);
                        // 受训人员数据
                        traineeY.push(obj[i].trainee);
                        // 培训人员数据
                        trainerY.push(obj[i].trainer);
                    }
                    // 根据数据画柱状图
                    trainEducationAnalysis.drawComprehensiveTrain(depart, traineeY, trainerY);
                }else{
                    toastr.success("请求综合培训数据为空");
                }
            },
            error:function(){
                toastr.success("请求综合培训数据失败");
            }
        });
    },

    //三级教育和特种作业人员柱状图
    drawByData:function(arrX, specialY, primaryY){
        var myChart = echarts.init(document.getElementById('container1'));
        var option = {
            title : {
                text: '统计',
                textStyle:{
                    color:"#282828"
                },
                x:'left'
            },
            tooltip : {
                trigger: 'axis',
                // 坐标轴指示器,坐标轴触发有效
                axisPointer : {
                    // 默认为直线,可选为:'line' | 'shadow'
                    type : 'shadow'
                }
            },
            // 不同颜色代表的含义
            legend: {
                bottom:-8,
                data: ['入场三级教育人数','特种作业人数'],
                textStyle:{
                    color:"#a4a7ab"
                }
            },
            // 直角坐标系内绘图网格
            grid: {
                // 值越大越靠近右侧
                x: 46,
                // 值越大越靠下
                y: 30,
                // 值越大越靠左
                x2: 32,
                // 值越大越靠上
                y2: 40,
                // 边框线宽
                borderWidth: 0
            },
            // x坐标轴刻度设置
            xAxis : [
                {
                    type : 'category',
                    data : arrX,
                    splitLine: {
                        show: false
                    },
                    axisLabel: {
                        show: true,
                        textStyle: {
                            color: '#a4a7ab',
                            align: 'center'
                        }
                    }
                }
            ],
            // y坐标轴刻度设置
            yAxis : [
                {
                    type : 'value',
                    min:0,
                    max:50,
                    splitLine: {
                        show: false
                    },
                    axisLabel: {
                        show: true,
                        textStyle: {
                            color: '#a4a7ab'
                        }
                    }
                }
            ],
            series : [
                {
                    name:'入场三级教育人数',
                    type:'bar',
                    barWidth: 15,//柱状图宽度
                    barMaxWidth: 15,//最大宽度
                    data: primaryY,
                    itemStyle:{
                        normal:{
                            color:"#6699CC"
                        }
                    }
                },
                {
                    name:'特种作业人数',
                    type:'bar',
                    barWidth: 15,//柱状图宽度
                    barMaxWidth: 15,//最大宽度
                    data: specialY,
                    itemStyle:{
                        normal:{
                            color:"#66CC33"
                        }
                    }
                }
            ]
        };
        myChart.setOption(option);
    },

    //综合培训柱状图
    drawComprehensiveTrain:function(depart, traineeY, trainerY){
        var myChart = echarts.init($("#container2")[0]);
        var option = {
            title : {
                text: '综合情况统计',
                textStyle:{
                    color:"#282828"
                },
                left:'50'
            },
            tooltip : {
                trigger: 'axis'
            },
            // 直角坐标系内绘图网格
            grid: {
                borderWidth: 0
            },
            // 默认关闭可计算特性
            calculable : false,
            // 不同颜色代表的含义
            legend: {
                data:['培训数','受训人数'],
                textStyle:{
                    color:"#a4a7ab"
                },
                x:'center',
                y:'30'
            },
            xAxis : [
                {
                    type : 'category',
                    name : '项目',
                    data : depart,
                    splitLine: {
                        show: false
                    },
                    axisLabel: {
                        show: true,
                        textStyle: {
                            color: '#a4a7ab',
                            align: 'center'
                        }
                    }

                }
            ],
            yAxis : [
                {
                    type : 'value',
                    name : '培训数',
                    max:20,
                    min:0,
                    axisLabel : {
                        formatter: '{value} ',
                        textStyle: {
                            color: '#a4a7ab',
                            align: 'right'
                        }
                    },
                    splitLine: {
                        show: false
                    },
                },
                {
                    type : 'value',
                    name : '受训人数',
                    max:100,
                    min:0,
                    axisLabel : {
                        formatter: '{value} ',
                        textStyle: {
                            color: '#a4a7ab',
                            align: 'right'
                        }
                    },
                    splitLine: {
                        show: false
                    },
                },

            ],
            series : [
                {
                    name:'培训数',
                    // 设置图表类型为柱状图
                    type:'bar',
                    barWidth:30,
                    barMaxWidth:30,
                    stack: '培训数',
                    data: trainerY,
                    itemStyle: {
                        normal: {
                            color:"#A00000"
                        }
                    }
                },
                {
                    name:'受训人数',
                    // 设置图表类型为折线图
                    type:'line',
                    yAxisIndex: 1,
                    data: traineeY,
                    itemStyle: {
                        normal: {
                            color:"#500000"
                        }
                    }
                },

            ]
        };
        myChart.setOption(option);
    }
});

三、效果图

猜你喜欢

转载自www.cnblogs.com/flyShare/p/12557998.html