关于在uni app中运用图表
今天写项目,需要在uni app中使用图表,我使用的是ucharts.
具体操作如下
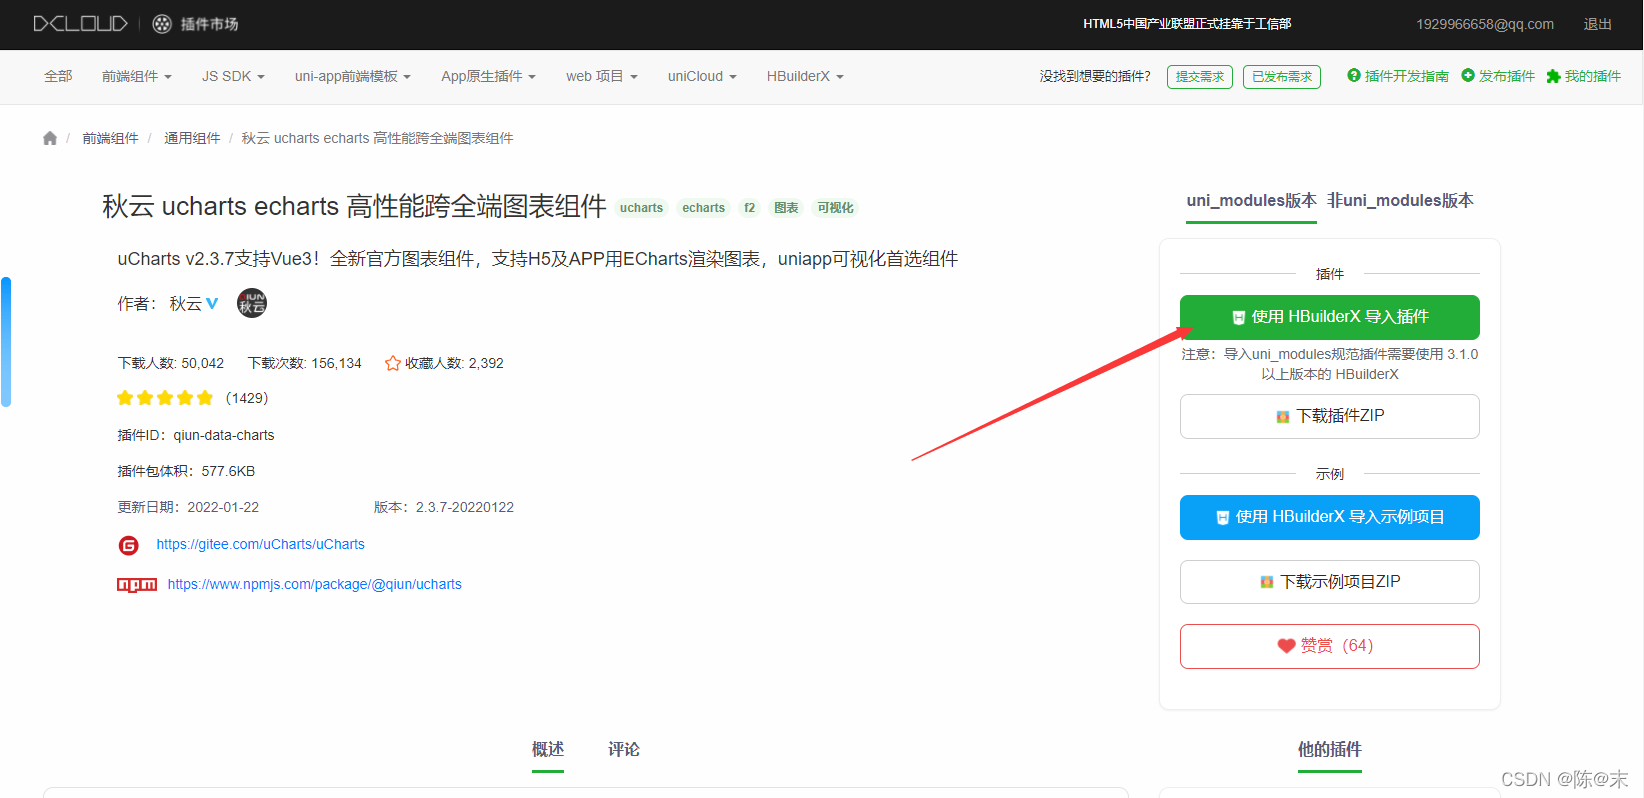
1.下载
ucharts可以直接在uni app的插件市场下载安装.
先在插件市场下载ucharts,导入到自己要使用的图表的项目.
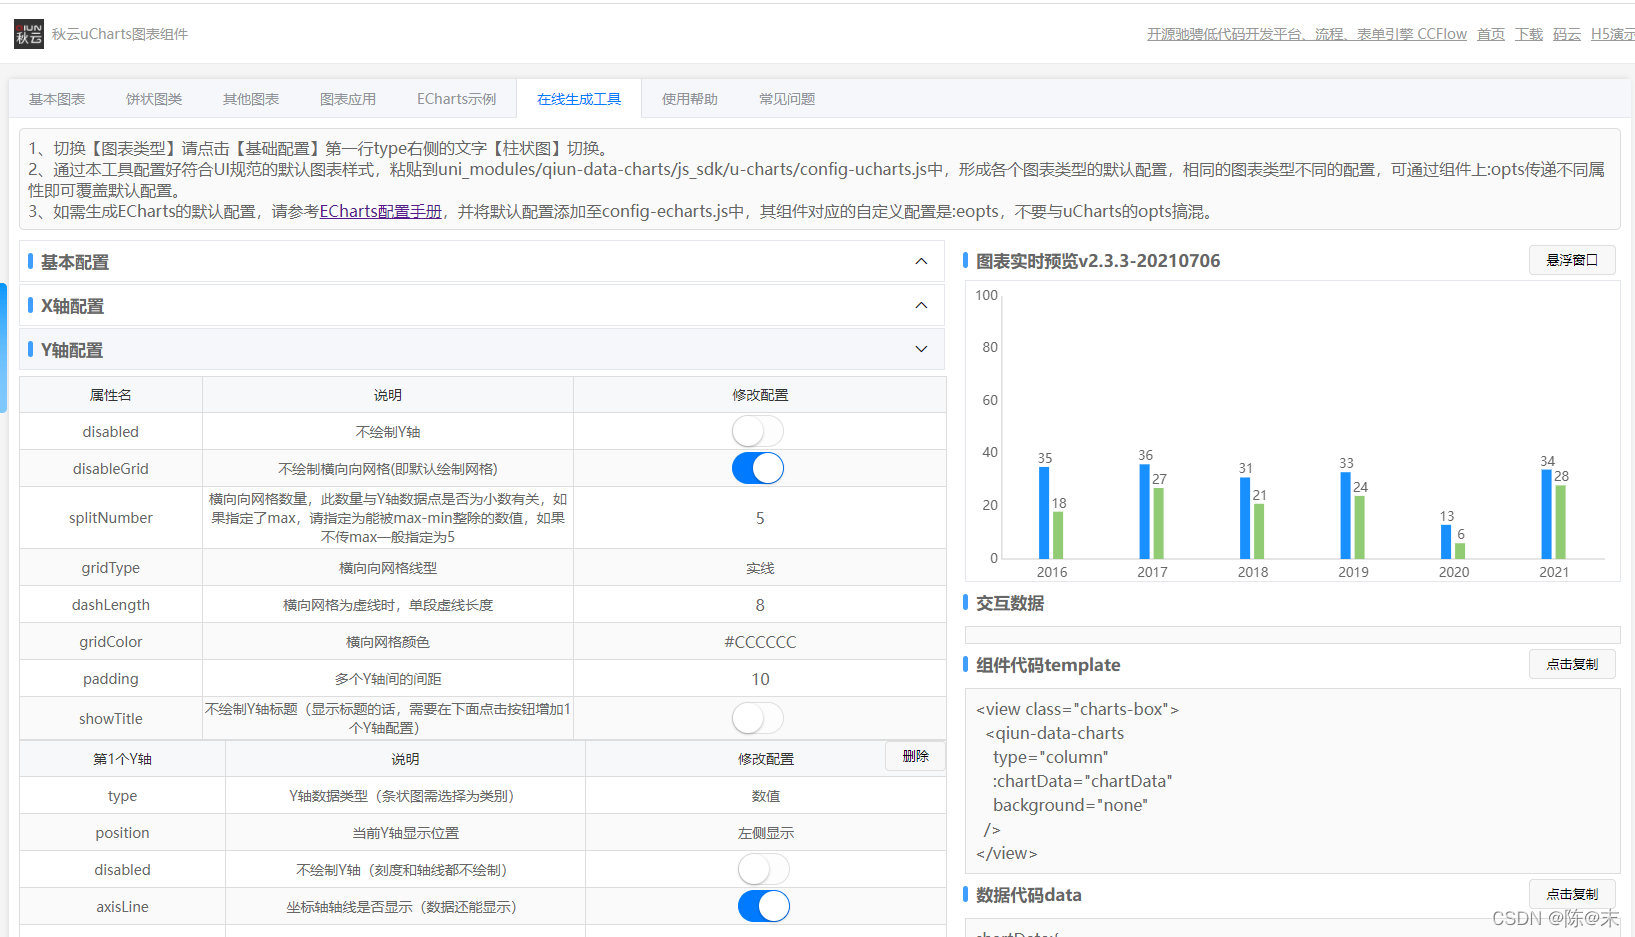
2.使用
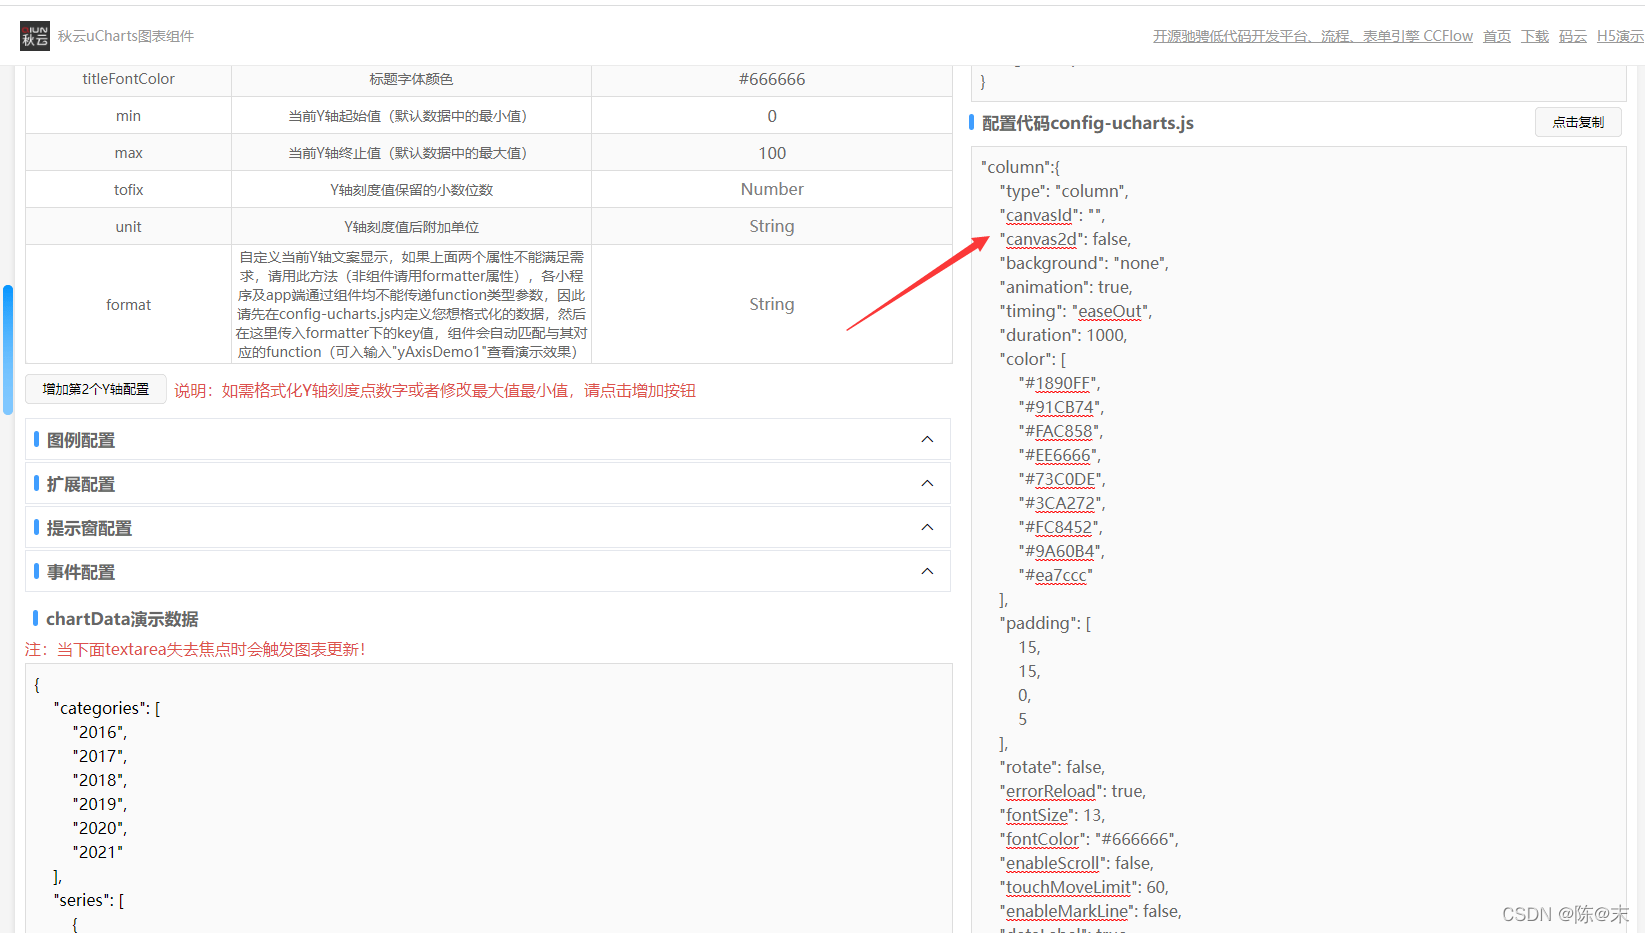
先用在线生成工具生成自己想要的样式.
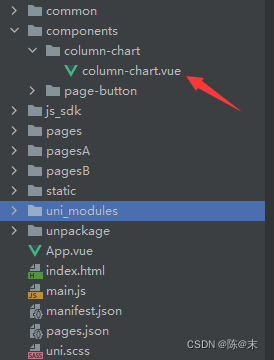
然后就是导入项目中,因为我一个页面要用很多不同的图表,所以我就把不同的图表给拆成不同的组件了.
在组件里面将刚刚在线生成的代码拷进去
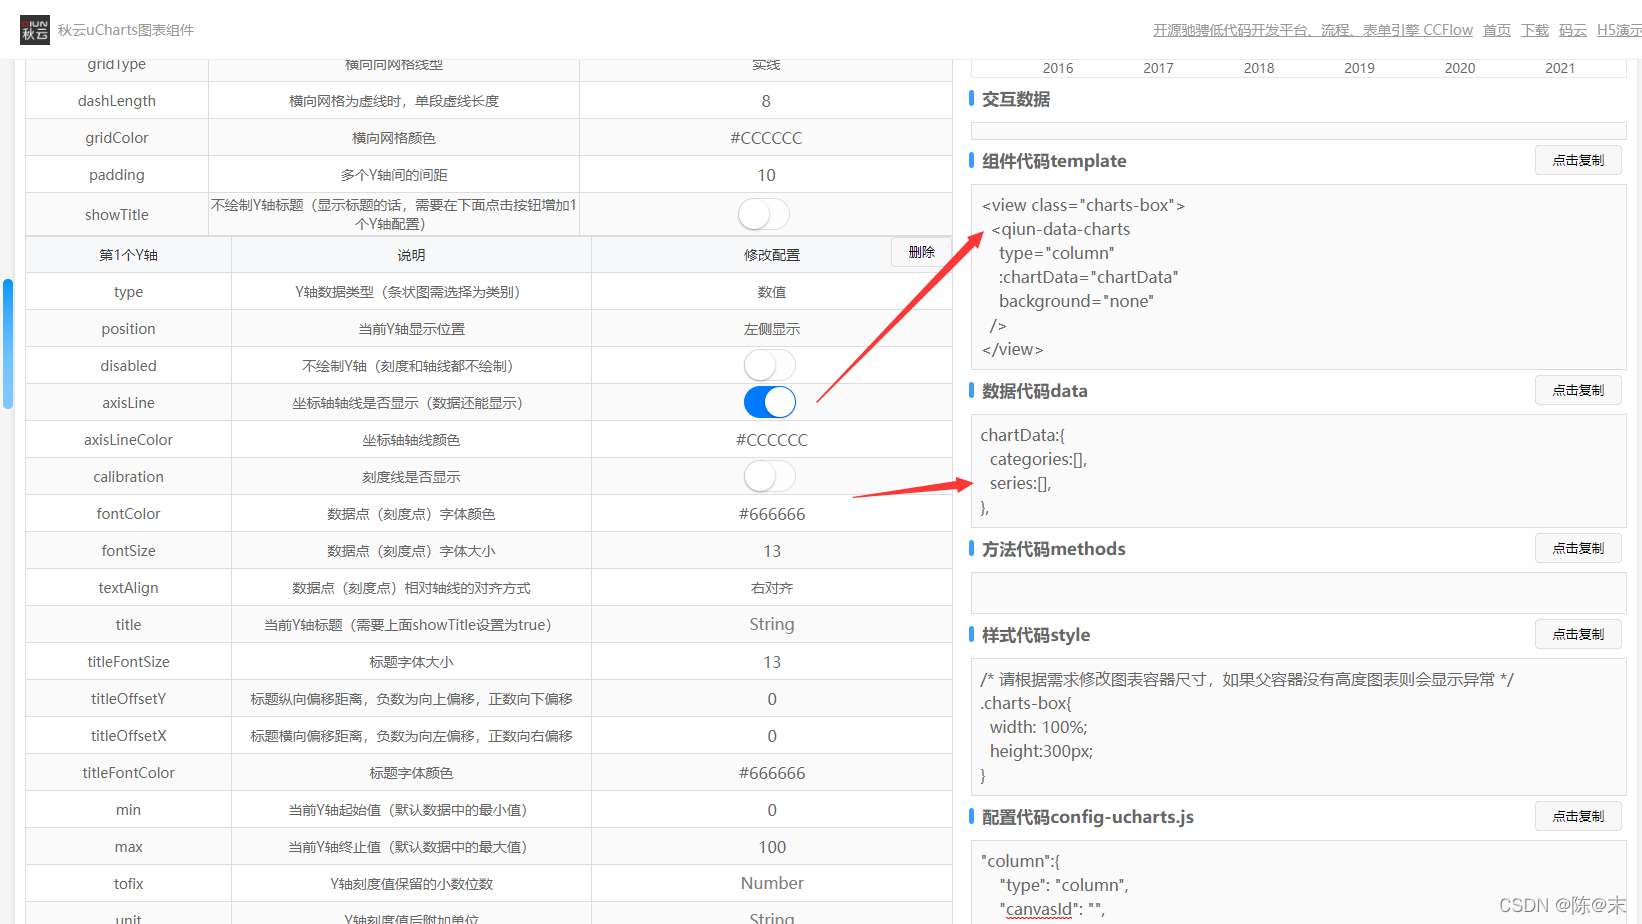

最后就是把刚刚自己的样式配置给拷进去
3.展示
最后在自己的页面,引入组件就可以了
下面是我的组件代码
<template>
  <view class="column-chart">
    <qiun-data-charts
        type="column"
        :chartData="chartData"
        :opts="opts"
        background="#FFFFFF"
    />
  </view>
</template>

<script>
export default {
  name: "column-chart",
  data() {
    return {
      chartData: {
        categories: [
          "10/18",
          "10/19",
          "10/20",
          "10/21",
          "10/22",
          "10/23",
          "10/24"],
        series: [{
          "name": "开房率",
          "data": [
            60,
            27,
            21,
            24,
            6,
            28,
            40
          ]
        }],
      },
      opts: {
        "type": "column",
        "canvasId": "",
        "canvas2d": false,
        "background": "#FFFFFF",
        "animation": true,
        "timing": "easeOut",
        "duration": 1000,
        "color": [
          "#0E9CFF",
          "#91CB74",
          "#FAC858",
          "#EE6666",
          "#73C0DE",
          "#3CA272",
          "#FC8452",
          "#9A60B4",
          "#ea7ccc"
        ],
        "padding": [
          15,
          15,
          0,
          5
        ],
        "rotate": false,
        "errorReload": true,
        "fontSize": 10,
        "fontColor": "#333333",
        "enableScroll": false,
        "touchMoveLimit": 60,
        "enableMarkLine": false,
        "dataLabel": true,
        "dataPointShape": true,
        "dataPointShapeType": "solid",
        "tapLegend": true,
        "xAxis": {
          "disabled": false,
          "axisLine": true,
          "axisLineColor": "#CCCCCC",
          "calibration": false,
          "fontColor": "#333333",
          "fontSize": 12,
          "rotateLabel": false,
          "itemCount": 5,
          "boundaryGap": "center",
          "disableGrid": true,
          "gridColor": "#CCCCCC",
          "gridType": "solid",
          "dashLength": 4,
          "gridEval": 1,
          "scrollShow": false,
          "scrollAlign": "left",
          "scrollColor": "#A6A6A6",
          "scrollBackgroundColor": "#EFEBEF",
          "format": ""
        },
        "yAxis": {
          "disabled": false,
          "disableGrid": true,
          "splitNumber": 4,
          "gridType": "solid",
          "dashLength": 8,
          "gridColor": "#CCCCCC",
          "padding": 10,
          "showTitle": false,
          "data": [
            {"max": 100}
          ]
        },
        "legend": {
          "show": false,
          "position": "bottom",
          "float": "center",
          "padding": 5,
          "margin": 5,
          "backgroundColor": "rgba(0,0,0,0)",
          "borderColor": "rgba(0,0,0,0)",
          "borderWidth": 0,
          "fontSize": 13,
          "fontColor": "#666666",
          "lineHeight": 11,
          "hiddenColor": "#CECECE",
          "itemGap": 10
        },
        "extra": {
          "column": {
            "type": "group",
            "width": 12,
            "seriesGap": 2,
            "categoryGap": 3,
            "barBorderCircle": false,
            "linearType": "none",
            "linearOpacity": 1,
            "colorStop": 0,
            "meterBorder": 1,
            "meterFillColor": "#FFFFFF",
            "activeBgColor": "#000000",
            "activeBgOpacity": 0.08,
            "meterBorde": 1
          },
          "tooltip": {
            "showBox": true,
            "showArrow": true,
            "showCategory": false,
            "borderWidth": 0,
            "borderRadius": 0,
            "borderColor": "#000000",
            "borderOpacity": 0.7,
            "bgColor": "#000000",
            "bgOpacity": 0.7,
            "gridType": "solid",
            "dashLength": 4,
            "gridColor": "#CCCCCC",
            "fontColor": "#FFFFFF",
            "splitLine": true,
            "horizentalLine": false,
            "xAxisLabel": false,
            "yAxisLabel": false,
            "labelBgColor": "#FFFFFF",
            "labelBgOpacity": 0.7,
            "labelFontColor": "#666666"
          },
          "markLine": {
            "type": "solid",
            "dashLength": 4,
            "data": []
          }
        }
      }
    };
  }
}
</script>

<style lang="scss" scoped>
.column-chart {
  width: 100%;
  height: 100%;
}
</style>
4.总结
就我现在的需求来看,ucharts是比较好用的,直接傻瓜式生成,然后复制粘贴就可以了.