基于统计分析的电影推荐(关键词)
主要步骤
1.数据读取与特征选择
2.数据可视化展示
3.数据清洗
4.推荐
- 数据格式处理
进行json解析,解析成pandas格式,获取到自己用的指标([‘genres’, ‘keywords’, ‘production_countries’, ‘production_companies’, 'spoken_languages)
返回结果为df
把数据集名字进行格式转换
对数据进行进一步提取(时间等)
import json
import pandas as pd
#___________________________
def load_tmdb_movies(path):
    df = pd.read_csv(path)
    df['release_date'] = pd.to_datetime(df['release_date']).apply(lambda x: x.date())
    json_columns = ['genres', 'keywords', 'production_countries',
                    'production_companies', 'spoken_languages']
    for column in json_columns:
        df[column] = df[column].apply(json.loads)
    return df
#___________________________
def load_tmdb_credits(path):
    df = pd.read_csv(path)
    json_columns = ['cast', 'crew']
    for column in json_columns:
        df[column] = df[column].apply(json.loads)
    return df
#___________________
LOST_COLUMNS = [
    'actor_1_facebook_likes',
    'actor_2_facebook_likes',
    'actor_3_facebook_likes',
    'aspect_ratio',
    'cast_total_facebook_likes',
    'color',
    'content_rating',
    'director_facebook_likes',
    'facenumber_in_poster',
    'movie_facebook_likes',
    'movie_imdb_link',
    'num_critic_for_reviews',
    'num_user_for_reviews']
#____________________________________
TMDB_TO_IMDB_SIMPLE_EQUIVALENCIES = {
    'budget': 'budget',
    'genres': 'genres',
    'revenue': 'gross',
    'title': 'movie_title',
    'runtime': 'duration',
    'original_language': 'language',
    'keywords': 'plot_keywords',
    'vote_count': 'num_voted_users'}
#_____________________________________________________
IMDB_COLUMNS_TO_REMAP = {'imdb_score': 'vote_average'}
#_____________________________________________________
def safe_access(container, index_values):
    # return missing value rather than an error upon indexing/key failure
    result = container
    try:
        for idx in index_values:
            result = result[idx]
        return result
    except IndexError or KeyError:
        return pd.np.nan
#_____________________________________________________
def get_director(crew_data):
    directors = [x['name'] for x in crew_data if x['job'] == 'Director']
    return safe_access(directors, [0])
#_____________________________________________________
def pipe_flatten_names(keywords):
    return '|'.join([x['name'] for x in keywords])
#_____________________________________________________
def convert_to_original_format(movies, credits):
    tmdb_movies = movies.copy()
    tmdb_movies.rename(columns=TMDB_TO_IMDB_SIMPLE_EQUIVALENCIES, inplace=True)
    tmdb_movies['title_year'] = pd.to_datetime(tmdb_movies['release_date']).apply(lambda x: x.year)
    # I'm assuming that the first production country is equivalent, but have not been able to validate this
    tmdb_movies['country'] = tmdb_movies['production_countries'].apply(lambda x: safe_access(x, [0, 'name']))
    tmdb_movies['language'] = tmdb_movies['spoken_languages'].apply(lambda x: safe_access(x, [0, 'name']))
    tmdb_movies['director_name'] = credits['crew'].apply(get_director)
    tmdb_movies['actor_1_name'] = credits['cast'].apply(lambda x: safe_access(x, [1, 'name']))
    tmdb_movies['actor_2_name'] = credits['cast'].apply(lambda x: safe_access(x, [2, 'name']))
    tmdb_movies['actor_3_name'] = credits['cast'].apply(lambda x: safe_access(x, [3, 'name']))
    tmdb_movies['genres'] = tmdb_movies['genres'].apply(pipe_flatten_names)
    tmdb_movies['plot_keywords'] = tmdb_movies['plot_keywords'].apply(pipe_flatten_names)
    return tmdb_movies
导入一些处理数据集的数据包(画图工具和数据处理)
线性回归和k近邻
import numpy as np
import matplotlib as mpl
import matplotlib.pyplot as plt
import seaborn as sns
import math, nltk, warnings
from nltk.corpus import wordnet
from sklearn import linear_model
from sklearn.neighbors import NearestNeighbors
from fuzzywuzzy import fuzz
from wordcloud import WordCloud, STOPWORDS
plt.rcParams["patch.force_edgecolor"] = True
plt.style.use('fivethirtyeight')
mpl.rc('patch', edgecolor = 'dimgray', linewidth=1)
from IPython.core.interactiveshell import InteractiveShell
InteractiveShell.ast_node_interactivity = "last_expr"
pd.options.display.max_columns = 50
%matplotlib inline
warnings.filterwarnings('ignore')
PS = nltk.stem.PorterStemmer()
#__________________
# load the dataset
credits = load_tmdb_credits("tmdb_5000_credits.csv")
credits.head()
查看当前的电影数据集(tmdb_5000_movies.csv)
json处理过的
movies = load_tmdb_movies("tmdb_5000_movies.csv")
movies.head()
df_initial = convert_to_original_format(movies, credits)
df_initial.head()
数据情况展示
画图展示(类型,缺失值,缺失值占比)
# info on variable types and filling factor
tab_info=pd.DataFrame(df_initial.dtypes).T.rename(index={0:'column type'})
tab_info=tab_info.append(pd.DataFrame(df_initial.isnull().sum()).T.rename(index={0:'null values'}))
tab_info=tab_info.append(pd.DataFrame(df_initial.isnull().sum()/df_initial.shape[0]*100).T.
                         rename(index={0:'null values (%)'}))
tab_info
关键词信息
把所有关键词进行获取
set_keywords = set()
for liste_keywords in df_initial['plot_keywords'].str.split('|').values:
    if isinstance(liste_keywords, float): continue  # only happen if liste_keywords = NaN
    set_keywords = set_keywords.union(liste_keywords)
#_________________________
# remove null chain entry
set_keywords.remove('')
统计关键词频率
词频从零开始进行,遍历关键词信息
并进行排序
def count_word(df, ref_col, liste):
    keyword_count = dict()
    for s in liste: keyword_count[s] = 0
    for liste_keywords in df[ref_col].str.split('|'):
        if type(liste_keywords) == float and pd.isnull(liste_keywords): continue
        for s in [s for s in liste_keywords if s in liste]:
            if pd.notnull(s): keyword_count[s] += 1
    #______________________________________________________________________
    # convert the dictionary in a list to sort the keywords by frequency
    keyword_occurences = []
    for k,v in keyword_count.items():
        keyword_occurences.append([k,v])
    keyword_occurences.sort(key = lambda x:x[1], reverse = True)
    return keyword_occurences, keyword_count
展示一下前五个关键词,以及出现次数
keyword_occurences, dum = count_word(df_initial, 'plot_keywords', set_keywords)
keyword_occurences[:5]
关键词情况展示:词云和统计图展示关键词出现的次数(出现最多的50个词)
def random_color_func(word=None, font_size=None, position=None,
                      orientation=None, font_path=None, random_state=None):
    h = int(360.0 * tone / 255.0)
    s = int(100.0 * 255.0 / 255.0)
    l = int(100.0 * float(random_state.randint(70, 120)) / 255.0)
    return "hsl({}, {}%, {}%)".format(h, s, l)
#_____________________________________________
# UPPER PANEL: WORDCLOUD
fig = plt.figure(1, figsize=(18,13))
ax1 = fig.add_subplot(2,1,1)
#_______________________________________________________
# I define the dictionary used to produce the wordcloud
words = dict()
trunc_occurences = keyword_occurences[0:50]
for s in trunc_occurences:
    words[s[0]] = s[1]
tone = 55.0 # define the color of the words
#________________________________________________________
wordcloud = WordCloud(width=1000,height=300, background_color='black',
                      max_words=1628,relative_scaling=1,
                      color_func = random_color_func,
                      normalize_plurals=False)
wordcloud.generate_from_frequencies(words)
ax1.imshow(wordcloud, interpolation="bilinear")
ax1.axis('off')
#_____________________________________________
# LOWER PANEL: HISTOGRAMS
ax2 = fig.add_subplot(2,1,2)
y_axis = [i[1] for i in trunc_occurences]
x_axis = [k for k,i in enumerate(trunc_occurences)]
x_label = [i[0] for i in trunc_occurences]
plt.xticks(rotation=85, fontsize = 15)
plt.yticks(fontsize = 15)
plt.xticks(x_axis, x_label)
plt.ylabel("Nb. of occurences", fontsize = 18, labelpad = 10)
ax2.bar(x_axis, y_axis, align = 'center', color='g')
#_______________________
plt.title("Keywords popularity",bbox={'facecolor':'k', 'pad':5},color='w',fontsize = 25)
plt.show()

查看数据缺失情况
missing_df = df_initial.isnull().sum(axis=0).reset_index()
missing_df.columns = ['column_name', 'missing_count']
missing_df['filling_factor'] = (df_initial.shape[0]
                                - missing_df['missing_count']) / df_initial.shape[0] * 100
missing_df.sort_values('filling_factor').reset_index(drop = True)
电影年份(时代)统计
不同时代的人喜欢不同年代的电影
df_initial['decade'] = df_initial['title_year'].apply(lambda x:((x-1900)//10)*10)
#__________________________________________________________________
# function that extract statistical parameters from a grouby objet:
def get_stats(gr):
    return {'min':gr.min(),'max':gr.max(),'count': gr.count(),'mean':gr.mean()}
#______________________________________________________________
# Creation of a dataframe with statitical infos on each decade:
test = df_initial['title_year'].groupby(df_initial['decade']).apply(get_stats).unstack()
test
画图展示电影年代分布
90‘s表示90年代的
sns.set_context("poster", font_scale=0.85)
#_______________________________
# funtion used to set the labels
def label(s):
    val = (1900 + s, s)[s < 100]
    chaine = '' if s < 50 else "{}'s".format(int(val))
    return chaine
#____________________________________
plt.rc('font', weight='bold')
f, ax = plt.subplots(figsize=(11, 6))
labels = [label(s) for s in  test.index]
sizes  = test['count'].values
explode = [0.2 if sizes[i] < 100 else 0.01 for i in range(11)]
ax.pie(sizes, explode = explode, labels=labels,
       autopct = lambda x:'{:1.0f}%'.format(x) if x > 1 else '',
       shadow=False, startangle=0)
ax.axis('equal')
ax.set_title('% of films per decade',
             bbox={'facecolor':'k', 'pad':5},color='w', fontsize=16);
df_initial.drop('decade', axis=1, inplace = True)

电影类型统计
通过genres查看,遍历次数
genre_labels = set()
for s in df_initial['genres'].str.split('|').values:
    genre_labels = genre_labels.union(set(s))
keyword_occurences, dum = count_word(df_initial, 'genres', genre_labels)
keyword_occurences[:5]
数据清洗
df_duplicate_cleaned = df_initial
(同义词转化)
# Collect the keywords
#----------------------
def keywords_inventory(dataframe, colonne = 'plot_keywords'):
    PS = nltk.stem.PorterStemmer()
    keywords_roots  = dict()  # collect the words / root
    keywords_select = dict()  # association: root <-> keyword
    category_keys = []
    icount = 0
    for s in dataframe[colonne]:
        if pd.isnull(s): continue
        for t in s.split('|'):
            t = t.lower() ; racine = PS.stem(t)
            if racine in keywords_roots:
                keywords_roots[racine].add(t)
            else:
                keywords_roots[racine] = {t}

    for s in keywords_roots.keys():
        if len(keywords_roots[s]) > 1:
            min_length = 1000
            for k in keywords_roots[s]:
                if len(k) < min_length:
                    clef = k ; min_length = len(k)
            category_keys.append(clef)
            keywords_select[s] = clef
        else:
            category_keys.append(list(keywords_roots[s])[0])
            keywords_select[s] = list(keywords_roots[s])[0]

    print("Nb of keywords in variable '{}': {}".format(colonne,len(category_keys)))
    return category_keys, keywords_roots, keywords_select
查看处理过的关键词次数
keywords, keywords_roots, keywords_select = keywords_inventory(df_duplicate_cleaned,
                                                               colonne = 'plot_keywords')
出现在相近变体中的关键字样本的绘图
#------------------------------------------------------------
icount = 0
for s in keywords_roots.keys():
    if len(keywords_roots[s]) > 1:
        icount += 1
        if icount < 15: print(icount, keywords_roots[s], len(keywords_roots[s]))
替换关键字
#----------------------------------------------
def remplacement_df_keywords(df, dico_remplacement, roots = False):
    df_new = df.copy(deep = True)
    for index, row in df_new.iterrows():
        chaine = row['plot_keywords']
        if pd.isnull(chaine): continue
        nouvelle_liste = []
        for s in chaine.split('|'):
            clef = PS.stem(s) if roots else s
            if clef in dico_remplacement.keys():
                nouvelle_liste.append(dico_remplacement[clef])
            else:
                nouvelle_liste.append(s)
        df_new.set_value(index, 'plot_keywords', '|'.join(nouvelle_liste))
    return df_new
#-------------------------------------------------
df_keywords_cleaned = remplacement_df_keywords(df_duplicate_cleaned, keywords_select,
                                               roots = True)
关键词出现的次数
#----------------------------------
keywords.remove('')
keyword_occurences, key
#--------------------------------------------------------------
def get_synonymes(mot_cle):
    lemma = set()
    for ss in wordnet.synsets(mot_cle):
        for w in ss.lemma_names():
            #_______________________________
            # We just get the 'nouns':
            index = ss.name().find('.')+1
            if ss.name()[index] == 'n': lemma.add(w.lower().replace('_',' '))
    return lemma
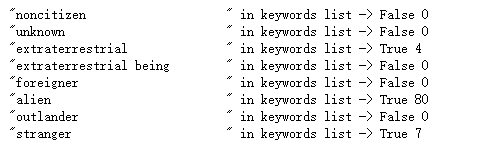
通过NLTK提供的同义词列查看同义词以及次数
#---------------------------------------------------
mot_cle = 'alien'
lemma = get_synonymes(mot_cle)
for s in lemma:
    print(' "{:<30}" in keywords list -> {} {}'.format(s, s in keywords,
                                                keywords_count[s] if s in keywords else 0 ))
下载工具包
nltk.download()
检查是否存在并统计次数
#----------------------------------------------------------------------------------
def test_keyword(mot, key_count, threshold):
    return (False , True)[key_count.get(mot, 0) >= threshold]
过滤操作
大于5次的关键词保留否则过滤掉
keyword_occurences.sort(key = lambda x:x[1], reverse = False)
key_count = dict()
for s in keyword_occurences:
    key_count[s[0]] = s[1]
#__________________________________________________________________________
# Creation of a dictionary to replace keywords by higher frequency keywords
remplacement_mot = dict()
icount = 0
for index, [mot, nb_apparitions] in enumerate(keyword_occurences):
    if nb_apparitions > 5: continue  # only the keywords that appear less than 5 times
    lemma = get_synonymes(mot)
    if len(lemma) == 0: continue     # case of the plurals
    #_________________________________________________________________
    liste_mots = [(s, key_count[s]) for s in lemma
                  if test_keyword(s, key_count, key_count[mot])]
    liste_mots.sort(key = lambda x:(x[1],x[0]), reverse = True)
    if len(liste_mots) <= 1: continue       # no replacement
    if mot == liste_mots[0][0]: continue    # replacement by himself
    icount += 1
    if  icount < 8:
        print('{:<12} -> {:<12} (init: {})'.format(mot, liste_mots[0][0], liste_mots))
    remplacement_mot[mot] = liste_mots[0][0]

print(90*'_'+'\n'+'The replacement concerns {}% of the keywords.'
      .format(round(len(remplacement_mot)/len(keywords)*100,2)))
#---------------------------
print('Keywords that appear both in keys and values:'.upper()+'\n'+45*'-')
icount = 0
for s in remplacement_mot.values():
    if s in remplacement_mot.keys():
        icount += 1
        if icount < 10: print('{:<20} -> {:<20}'.format(s, remplacement_mot[s]))

for key, value in remplacement_mot.items():
    if value in remplacement_mot.keys():
        remplacement_mot[key] = remplacement_mot[value]
现在的关键词
#----------------------------------------------------------
df_keywords_synonyms = \
            remplacement_df_keywords(df_keywords_cleaned, remplacement_mot, roots = False)
keywords, keywords_roots, keywords_select = \
            keywords_inventory(df_keywords_synonyms, colonne = 'plot_keywords')

再次过滤
关键字必须出现在三个及以上的电影中(否则过滤掉)
# deletion of keywords with low frequencies
#-------------------------------------------
def remplacement_df_low_frequency_keywords(df, keyword_occurences):
    df_new = df.copy(deep = True)
    key_count = dict()
    for s in keyword_occurences:
        key_count[s[0]] = s[1]
    for index, row in df_new.iterrows():
        chaine = row['plot_keywords']
        if pd.isnull(chaine): continue
        nouvelle_liste = []
        for s in chaine.split('|'):
            if key_count.get(s, 4) > 3: nouvelle_liste.append(s)
        df_new.set_value(index, 'plot_keywords', '|'.join(nouvelle_liste))
    return df_new
# Creation of a dataframe where keywords of low frequencies are suppressed
#-------------------------------------------------------------------------
df_keywords_occurence = \
    remplacement_df_low_frequency_keywords(df_keywords_synonyms, new_keyword_occurences)
keywords, keywords_roots, keywords_select = \
    keywords_inventory(df_keywords_occurence, colonne = 'plot_keywords')
过滤之前与过滤之后的对比
# Graph of keyword occurences
#----------------------------
font = {'family' : 'fantasy', 'weight' : 'normal', 'size'   : 15}
mpl.rc('font', **font)

keyword_occurences.sort(key = lambda x:x[1], reverse = True)

y_axis = [i[1] for i in keyword_occurences]
x_axis = [k for k,i in enumerate(keyword_occurences)]

new_y_axis = [i[1] for i in new_keyword_occurences]
new_x_axis = [k for k,i in enumerate(new_keyword_occurences)]

f, ax = plt.subplots(figsize=(9, 5))
ax.plot(x_axis, y_axis, 'r-', label='before cleaning')
ax.plot(new_x_axis, new_y_axis, 'b-', label='after cleaning')

# Now add the legend with some customizations.
legend = ax.legend(loc='upper right', shadow=True)
frame = legend.get_frame()
frame.set_facecolor('0.90')
for label in legend.get_texts():
    label.set_fontsize('medium')

plt.ylim((0,25))
plt.axhline(y=3.5, linewidth=2, color = 'k')
plt.xlabel("keywords index", family='fantasy', fontsize = 15)
plt.ylabel("Nb. of occurences", family='fantasy', fontsize = 15)
#plt.suptitle("Nombre d'occurences des mots clés", fontsize = 18, family='fantasy')
plt.text(3500, 4.5, 'threshold for keyword delation', fontsize = 13)

构建特征相关性
可以处理缺失值
f, ax = plt.subplots(figsize=(12, 9))
#_____________________________
# calculations of correlations
corrmat = df_keywords_occurence.dropna(how='any').corr()
#________________________________________
k = 17 # number of variables for heatmap
cols = corrmat.nlargest(k, 'num_voted_users')['num_voted_users'].index
cm = np.corrcoef(df_keywords_occurence[cols].dropna(how='any').values.T)
sns.set(font_scale=1.25)
hm = sns.heatmap(cm, cbar=True, annot=True, square=True,
                 fmt='.2f', annot_kws={'size': 10}, linewidth = 0.1, cmap = 'coolwarm',
                 yticklabels=cols.values, xticklabels=cols.values)
f.text(0.5, 0.93, "Correlation coefficients", ha='center', fontsize = 18, family='fantasy')
plt.show()

df_var_cleaned = df_keywords_occurence.copy(deep = True)
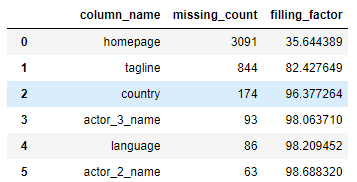
缺失值
missing_df = df_var_cleaned.isnull().sum(axis=0).reset_index()
missing_df.columns = ['column_name', 'missing_count']
missing_df['filling_factor'] = (df_var_cleaned.shape[0]
                                - missing_df['missing_count']) / df_var_cleaned.shape[0] * 100
missing_df = missing_df.sort_values('filling_factor').reset_index(drop = True)
missing_df
y_axis = missing_df['filling_factor']
x_label = missing_df['column_name']
x_axis = missing_df.index

fig = plt.figure(figsize=(11, 4))
plt.xticks(rotation=80, fontsize = 14)
plt.yticks(fontsize = 13)

N_thresh = 5
plt.axvline(x=N_thresh-0.5, linewidth=2, color = 'r')
plt.text(N_thresh-4.8, 30, 'filling factor \n < {}%'.format(round(y_axis[N_thresh],1)),
         fontsize = 15, family = 'fantasy', bbox=dict(boxstyle="round",
                   ec=(1.0, 0.5, 0.5),
                   fc=(0.8, 0.5, 0.5)))
N_thresh = 17
plt.axvline(x=N_thresh-0.5, linewidth=2, color = 'g')
plt.text(N_thresh, 30, 'filling factor \n = {}%'.format(round(y_axis[N_thresh],1)),
         fontsize = 15, family = 'fantasy', bbox=dict(boxstyle="round",
                   ec=(1., 0.5, 0.5),
                   fc=(0.5, 0.8, 0.5)))

plt.xticks(x_axis, x_label,family='fantasy', fontsize = 14 )
plt.ylabel('Filling factor (%)', family='fantasy', fontsize = 16)
plt.bar(x_axis, y_axis);
缺失值填充
df_filling = df_var_cleaned.copy(deep=True)
missing_year_info = df_filling[df_filling['title_year'].isnull()][[
            'director_name','actor_1_name', 'actor_2_name', 'actor_3_name']]
missing_year_info[:10]
df_filling.iloc[4553]
def fill_year(df):
    col = ['director_name', 'actor_1_name', 'actor_2_name', 'actor_3_name']
    usual_year = [0 for _ in range(4)]
    var        = [0 for _ in range(4)]
    #_____________________________________________________________
    # I get the mean years of activity for the actors and director
    for i in range(4):
        usual_year[i] = df.groupby(col[i])['title_year'].mean()
    #_____________________________________________
    # I create a dictionnary collectinf this info
    actor_year = dict()
    for i in range(4):
        for s in usual_year[i].index:
            if s in actor_year.keys():
                if pd.notnull(usual_year[i][s]) and pd.notnull(actor_year[s]):
                    actor_year[s] = (actor_year[s] + usual_year[i][s])/2
                elif pd.isnull(actor_year[s]):
                    actor_year[s] = usual_year[i][s]
            else:
                actor_year[s] = usual_year[i][s]

    #______________________________________
    # identification of missing title years
    missing_year_info = df[df['title_year'].isnull()]
    #___________________________
    # filling of missing values
    icount_replaced = 0
    for index, row in missing_year_info.iterrows():
        value = [ np.NaN for _ in range(4)]
        icount = 0 ; sum_year = 0
        for i in range(4):
            var[i] = df.loc[index][col[i]]
            if pd.notnull(var[i]): value[i] = actor_year[var[i]]
            if pd.notnull(value[i]): icount += 1 ; sum_year += actor_year[var[i]]
        if icount != 0: sum_year = sum_year / icount

        if int(sum_year) > 0:
            icount_replaced += 1
            df.set_value(index, 'title_year', int(sum_year))
            if icount_replaced < 10:
                print("{:<45} -> {:<20}".format(df.loc[index]['movie_title'],int(sum_year)))
    return
fill_year(df_filling)
用名字中的信息来填充关键词(比如电影没有关键词,可以拿标题代替)
icount = 0
for index, row in df_filling[df_filling['plot_keywords'].isnull()].iterrows():
    icount += 1
    liste_mot = row['movie_title'].strip().split()
    new_keyword = []
    for s in liste_mot:
        lemma = get_synonymes(s)
        for t in list(lemma):
            if t in keywords:
                new_keyword.append(t)
    if new_keyword and icount < 15:
        print('{:<50} -> {:<30}'.format(row['movie_title'], str(new_keyword)))
    if new_keyword:
        df_filling.set_value(index, 'plot_keywords', '|'.join(new_keyword))
cols = corrmat.nlargest(9, 'num_voted_users')['num_voted_users'].index
cm = np.corrcoef(df_keywords_occurence[cols].dropna(how='any').values.T)
sns.set(font_scale=1.25)
hm = sns.heatmap(cm, cbar=True, annot=True, square=True,
                 fmt='.2f', annot_kws={'size': 10},
                 yticklabels=cols.values, xticklabels=cols.values)
plt.show()
利用回归来进行填充
sns.set(font_scale=1.25)
cols = ['gross', 'num_voted_users']
sns.pairplot(df_filling.dropna(how='any')[cols],diag_kind='kde', size = 2.5)
plt.show();

def variable_linreg_imputation(df, col_to_predict, ref_col):
    regr = linear_model.LinearRegression()
    test = df[[col_to_predict,ref_col]].dropna(how='any', axis = 0)
    X = np.array(test[ref_col])
    Y = np.array(test[col_to_predict])
    X = X.reshape(len(X),1)
    Y = Y.reshape(len(Y),1)
    regr.fit(X, Y)

    test = df[df[col_to_predict].isnull() & df[ref_col].notnull()]
    for index, row in test.iterrows():
        value = float(regr.predict(row[ref_col]))
        df.set_value(index, col_to_predict, value)
variable_linreg_imputation(df_filling, 'gross', 'num_voted_users')
df = df_filling.copy(deep = True)
missing_df = df.isnull().sum(axis=0).reset_index()
missing_df.columns = ['column_name', 'missing_count']
missing_df['filling_factor'] = (df.shape[0]
                                - missing_df['missing_count']) / df.shape[0] * 100
missing_df = missing_df.sort_values('filling_factor').reset_index(drop = True)
missing_df
df = df_filling.copy(deep=True)
df.reset_index(inplace = True, drop = True)
开始推荐
高斯得到权值
gaussian_filter = lambda x,y,sigma: math.exp(-(x-y)**2/(2*sigma**2))
def entry_variables(df, id_entry):
    col_labels = []
    if pd.notnull(df['director_name'].iloc[id_entry]):
        for s in df['director_name'].iloc[id_entry].split('|'):
            col_labels.append(s)

    for i in range(3):
        column = 'actor_NUM_name'.replace('NUM', str(i+1))
        if pd.notnull(df[column].iloc[id_entry]):
            for s in df[column].iloc[id_entry].split('|'):
                col_labels.append(s)

    if pd.notnull(df['plot_keywords'].iloc[id_entry]):
        for s in df['plot_keywords'].iloc[id_entry].split('|'):
            col_labels.append(s)
    return col_labels
def add_variables(df, REF_VAR):
    for s in REF_VAR: df[s] = pd.Series([0 for _ in range(len(df))])
    colonnes = ['genres', 'actor_1_name', 'actor_2_name',
                'actor_3_name', 'director_name', 'plot_keywords']
    for categorie in colonnes:
        for index, row in df.iterrows():
            if pd.isnull(row[categorie]): continue
            for s in row[categorie].split('|'):
                if s in REF_VAR: df.set_value(index, s, 1)
    return df
s为题材,得到所有的题材
电影关键词所有的信息放在 variables中
def recommand(df, id_entry):
    df_copy = df.copy(deep = True)
    liste_genres = set()
    for s in df['genres'].str.split('|').values:
        liste_genres = liste_genres.union(set(s))
    #_____________________________________________________
    # 创建其他变量以检查相似性
    variables = entry_variables(df_copy, id_entry)
    variables += list(liste_genres)
    df_new = add_variables(df_copy, variables)
    #____________________________________________________________________________________
    #确定最近邻:计算距离/新变量
    X = df_new.as_matrix(variables)
    nbrs = NearestNeighbors(n_neighbors=31, algorithm='auto', metric='euclidean').fit(X)

    distances, indices = nbrs.kneighbors(X)
    xtest = df_new.iloc[id_entry].as_matrix(variables)
    xtest = xtest.reshape(1, -1)

    distances, indices = nbrs.kneighbors(xtest)

    return indices[0][:]
def extract_parameters(df, liste_films):
    parametres_films = ['_' for _ in range(31)]
    i = 0
    max_users = -1
    for index in liste_films:
        parametres_films[i] = list(df.iloc[index][['movie_title', 'title_year',
                                        'imdb_score', 'num_user_for_reviews',
                                        'num_voted_users']])
        parametres_films[i].append(index)
        max_users = max(max_users, parametres_films[i][4] )
        i += 1

    title_main = parametres_films[0][0]
    annee_ref  = parametres_films[0][1]
    parametres_films.sort(key = lambda x:critere_selection(title_main, max_users,
                                    annee_ref, x[0], x[1], x[2], x[4]), reverse = True)

    return parametres_films
def sequel(titre_1, titre_2):
    if fuzz.ratio(titre_1, titre_2) > 50 or fuzz.token_set_ratio(titre_1, titre_2) > 50:
        return True
    else:
        return False
def critere_selection(title_main, max_users, annee_ref, titre, annee, imdb_score, votes):
    if pd.notnull(annee_ref):
        facteur_1 = gaussian_filter(annee_ref, annee, 20)
    else:
        facteur_1 = 1

    sigma = max_users * 1.0

    if pd.notnull(votes):
        facteur_2 = gaussian_filter(votes, max_users, sigma)
    else:
        facteur_2 = 0

    if sequel(title_main, titre):
        note = 0
    else:
        note = imdb_score**2 * facteur_1 * facteur_2

    return note
def add_to_selection(film_selection, parametres_films):
    film_list = film_selection[:]
    icount = len(film_list)
    for i in range(31):
        already_in_list = False
        for s in film_selection:
            if s[0] == parametres_films[i][0]: already_in_list = True
            if sequel(parametres_films[i][0], s[0]): already_in_list = True
        if already_in_list: continue
        icount += 1
        if icount <= 5:
            film_list.append(parametres_films[i])
    return film_list
def remove_sequels(film_selection):
    removed_from_selection = []
    for i, film_1 in enumerate(film_selection):
        for j, film_2 in enumerate(film_selection):
            if j <= i: continue
            if sequel(film_1[0], film_2[0]):
                last_film = film_2[0] if film_1[1] < film_2[1] else film_1[0]
                removed_from_selection.append(last_film)

    film_list = [film for film in film_selection if film[0] not in removed_from_selection]

    return film_list
def find_similarities(df, id_entry, del_sequels = True, verbose = False):
    if verbose:
        print(90*'_' + '\n' + "QUERY: films similar to id={} -> '{}'".format(id_entry,
                                df.iloc[id_entry]['movie_title']))
    #____________________________________
    liste_films = recommand(df, id_entry)
    #__________________________________
    # 列出电影
    parametres_films = extract_parameters(df, liste_films)
    #_______________________________________
    # 选择5个
    film_selection = []
    film_selection = add_to_selection(film_selection, parametres_films)
    #__________________________________
    # 电影的续集情况
    if del_sequels: film_selection = remove_sequels(film_selection)
    #______________________________________________
    # 添加新电影
    film_selection = add_to_selection(film_selection, parametres_films)
    #_____________________________________________
    selection_titres = []
    for i,s in enumerate(film_selection):
        selection_titres.append([s[0].replace(u'\xa0', u''), s[5]])
        if verbose: print("nº{:<2}     -> {:<30}".format(i+1, s[0]))

    return selection_titres
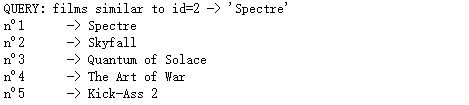
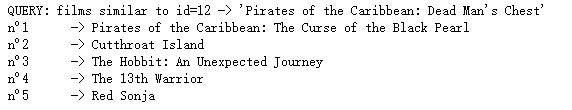
df为当前电影的库,12为id,是否过滤,
dum = find_similarities(df, 12, del_sequels = False, verbose = True)
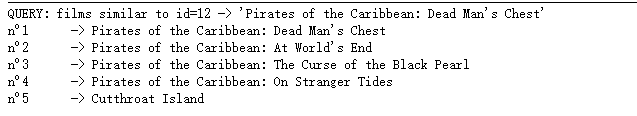
dum = find_similarities(df, 12, del_sequels = True, verbose = True)
dum = find_similarities(df, 2, del_sequels = True, verbose = True)