最近空余时间在参加数字中国创新大赛,比赛规则是根据模型的F1值对参赛者进行排名。为了更深刻地理解这个指标,我最近对它做了一些梳理,现在把它分享给更多有需要的人图片。最近在参赛时也发现了一个问题,就是算法在训练集上完全拟合(KS=1),但是到测试集上衰退得比较多,即出现了过拟合的现象。如果对过拟合调参比较有经验的小伙伴,欢迎到公众号中进行沟通交流。有正在参赛的小伙伴,想讨论赛题的也可以联系我。
对于分类模型,在建立好模型后,我们想对模型进行评价,常见的指标有混淆矩阵、F1值、KS曲线、ROC曲线、AUC面积等。也可以自己定义函数,把模型结果分割成n(100)份,计算top1的准确率、覆盖率。之前阐述了混淆矩阵和KS曲线,本文阐述F1值的原理和Python实现实例,其它指标会在后续文章中详尽阐述,敬请期待图片。
一、详细介绍F1值
1 什么是F1值
F1值又称为F1分数(F1-Score):是分类问题的一个衡量指标,它是精确率P(Precision)和召回率R(Recall)的调和平均数。
F1值的取值范围(0~1),越接近1说明模型预测效果越好,至于原因详见后文。
2 理解F1值的一个小例子
假设1代表涉赌涉诈账户,0代表非涉赌涉诈的低风险账户。
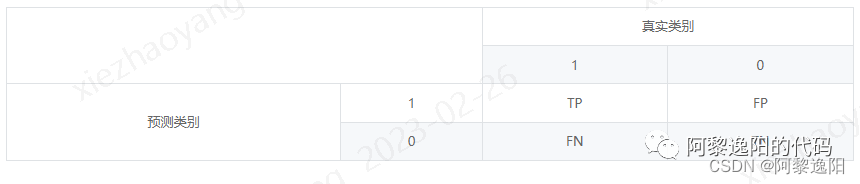
T:正确预测,F:错误预测,P:1,N:0。
- TP(True Positive):模型正确预测为1的数量,即真实值是1,模型预测为1的数量。
- FN(False Negative):模型错误预测为0的数量,即真实值是1,模型预测为0的数量。
- FP(False Positive):模型错误预测为1的数量,即真实值是0,模型预测为1的数量。
- TN(True Negative):模型正确预测为0的数量,即真实值是0,模型预测为0的数量。
精确率P(Precision):被模型预测为1的样本中,实际是1的样本占比。计算公式如下:
召回率R(Recall):实际是1的样本中,被模型预测为1(被模型找回了多少1)的样本占比。计算公式如下:
则
思考一个极端情况,所有涉赌涉诈账户的概率都高于正常账户的概率,那意味着我可以找到一个切割点,让P和R都等于1,即F1值为1。这时,说明模型能完全区分出涉赌涉诈账户和非涉赌涉诈账户。即F1值越接近1,模型效果越好。为了更清晰地看出P、R和F1值之间的趋势关系,我们把F1值变下型,得到如下结果:
可以尝试通分还原。从上式可以发现,当R不变时,P越大,分母越小,则F1值越大,同理可得R。说明P、R和F1是成正比的。
二、用Python如何计算F1值
在Python中计算F1值的代码有多种,本文提供两种。一种是写函数计算,一种是调用sklearn计算。
1 写函数计算F1值
首先看下写函数的方式:
#Recall = TP/(TP + FN)
#Precision = TP/(TP + FP)
from sklearn.linear_model import LogisticRegression
from sklearn.model_selection import KFold, cross_val_score
from sklearn.metrics import confusion_matrix, recall_score, classification_report

#绘制混淆矩阵
def plot_confusion_matrix(cm, classes,
                          normalize=False,
                          title='Confusion matrix',
                          cmap=plt.cm.Blues):
    """
    This function prints and plots the confusion matrix.
    Normalization can be applied by setting `normalize=True`.
    """
    if normalize:
        cm = cm.astype('float') / cm.sum(axis=1)[:, np.newaxis]
        print("Normalized confusion matrix")
    else:
        print('Confusion matrix, without normalization')

    print(cm)

    plt.imshow(cm, interpolation='nearest', cmap=cmap)
    plt.title(title)
    plt.colorbar()
    tick_marks = np.arange(len(classes))
    plt.xticks(tick_marks, classes, rotation=45)
    plt.yticks(tick_marks, classes)

    fmt = '.2f' if normalize else 'd'
    thresh = cm.max() / 2.
    for i, j in itertools.product(range(cm.shape[0]), range(cm.shape[1])):
        plt.text(j, i, format(cm[i, j], fmt),
                 horizontalalignment="center",
                 color="white" if cm[i, j] > thresh else "black")

    plt.tight_layout()
    plt.ylabel('True label')
    plt.xlabel('Predicted label')

def plot_confu_matrix_cal_F1(thresholds, date):
    '''
    thresholds:切割predict的阈值,比如:[0.1, 0.2, 0.3, 0.4, 0.5, 0.6]
    data:数据集,其中包含y标签列,predict预测列(可以是概率值,也可以是标签)
    '''
    import itertools
    thresholds =  thresholds
    plt.figure(figsize = (10, 10))
    j = 1
    for i in thresholds:
        y_test_predictions_high_recall = date['predict'] > i

        plt.subplot(3, 3, j)
        j += 1

        #Compute confusion mat
        cnf_matrix = confusion_matrix(date.y, y_test_predictions_high_recall)
        np.set_printoptions(precision = 2)

        recall_score_1 = cnf_matrix[1, 1] / (cnf_matrix[1, 1] + cnf_matrix[1, 0])
        accary_score_1 = cnf_matrix[1, 1] / (cnf_matrix[1, 1] + cnf_matrix[0, 1])
        F1_score = 2*recall_score_1*accary_score_1/(recall_score_1+accary_score_1)
        print("thresholds in the testing dataset:", i)
        print("Recall metric in the testing dataset:", cnf_matrix[1, 1] / (cnf_matrix[1, 1] + cnf_matrix[1, 0]))
        print("accary metric in the testing dataset:", cnf_matrix[1, 1] / (cnf_matrix[1, 1] + cnf_matrix[0, 1]))
        print("F1 score:", F1_score)
        # Plot non-normalized confusion matrix
        class_names = [0, 1]
        plot_confusion_matrix(cnf_matrix, classes = class_names, title = 'Threshold >= %s' %i)
F1值和混淆矩阵有关,该代码支持同时展示混淆矩阵和F1值。
2 写函数计算F1值具体实例
为了便于理解,举一个具体实例(参赛数据):
plot_confu_matrix_cal_F1(list(np.arange(0.4, 0.7, 0.05)), train_date)
thresholds:切割predict的阈值,本例中取的是list(np.arange(0.4, 0.7, 0.05))。
train_date:数据集,其中包含y标签列,predict预测列(可以是概率值,也可以是标签)。
得到结果如下:
thresholds in the testing dataset: 0.4
Recall metric in the testing dataset: 1.0
accary metric in the testing dataset: 1.0
F1 score: 1.0
Confusion matrix, without normalization
[[900   0]
 [  0 300]]
thresholds in the testing dataset: 0.45
Recall metric in the testing dataset: 1.0
accary metric in the testing dataset: 1.0
F1 score: 1.0
Confusion matrix, without normalization
[[900   0]
 [  0 300]]
thresholds in the testing dataset: 0.5
Recall metric in the testing dataset: 1.0
accary metric in the testing dataset: 1.0
F1 score: 1.0
Confusion matrix, without normalization
[[900   0]
 [  0 300]]
thresholds in the testing dataset: 0.55
Recall metric in the testing dataset: 1.0
accary metric in the testing dataset: 1.0
F1 score: 1.0
Confusion matrix, without normalization
[[900   0]
 [  0 300]]
thresholds in the testing dataset: 0.6
Recall metric in the testing dataset: 1.0
accary metric in the testing dataset: 1.0
F1 score: 1.0
Confusion matrix, without normalization
[[900   0]
 [  0 300]]
thresholds in the testing dataset: 0.6499999999999999
Recall metric in the testing dataset: 1.0
accary metric in the testing dataset: 1.0
F1 score: 1.0
Confusion matrix, without normalization
[[900   0]
 [  0 300]]
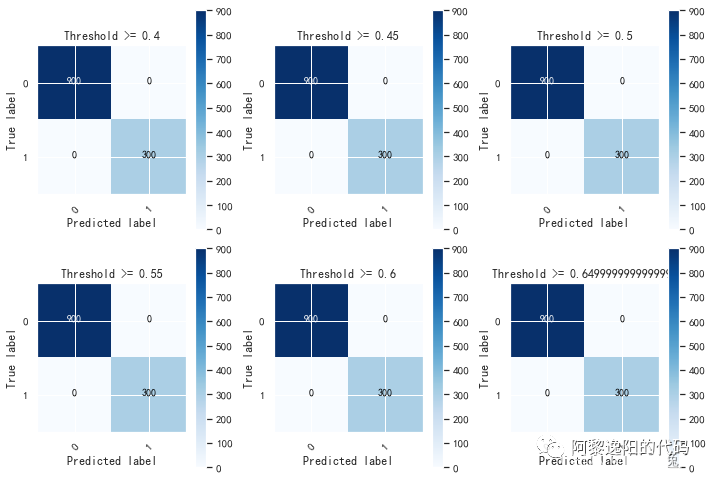
由于train_date中的predict是已经划分成0和1的标签,所以我设定0.4到0.65切割时,都是默认0是一组,1是1组。从上面的结果知,模型的精确率P(Precision)、召回率R(Recall)、F1值都为1,即模型在训练集上完全拟合,可以完全区分出涉赌涉诈账户和非涉赌涉诈账户。
3 调用sklearn计算F1值
本文只关注二分类问题的F1值计算,sklearn中f1_score函数参数如下:
from sklearn.metrics import f1_score
f1_score(y_true, y_pred, *, labels=None, pos_label=1, average='binary', sample_weight=None, zero_division='warn')
常用参数说明:
y_true:真实标签列。
y_pred:预测标签列。
labels:可选参数,默认为None,是一个一维数组,二分类时,不需要该参数。
应用同样的数据,在sklearn中调用f1_score函数,语句如下:
f1_score(train_date.y, train_date.predict)
得到结果:
1
可以发现计算结果和写函数计算的结果一致,都为1。至此,F1值的原理和Python实现实例已讲解完毕,感兴趣的同学可以自己尝试实现一下。
你可能感兴趣:
用Python绘制皮卡丘
用Python绘制词云图
用Python绘制520永恒心动
Python人脸识别—我的眼里只有你
Python画好看的星空图(唯美的背景)
【Python】情人节表白烟花(带声音和文字)
用Python中的py2neo库操作neo4j,搭建关联图谱
Python浪漫表白源码合集(爱心、玫瑰花、照片墙、星空下的告白)