数据分析就是在一大批杂乱无章的数据中,运用数字化工具和技术,探索数据内在的结构和规律,构建数学模型,并进行可视化表达,通过验证将模型转化为知识,为诊断过去、预测未来发挥作用。
一个数据库的例子:
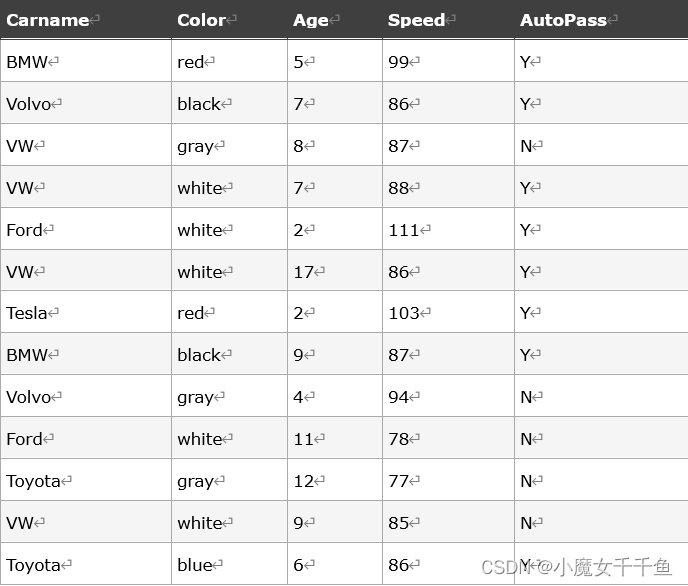
Carname=[ ]
Color=[ ]
Age=[5,7,8,7,2,17,2,9,4,11,12,9,6]
Speed=[99,86,87,88,111,86,103,87,94,78,77,85,86]
Autopass=[ ]
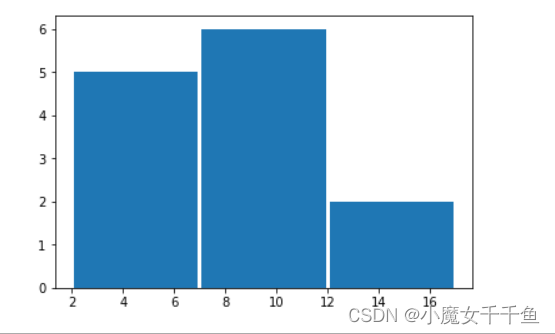
绘制直方图
为了可视化数据集,我们可以对收集的数据绘制直方图。我们将使用 Python 模块 Matplotlib 绘制直方图。
#车辆年龄直方图
import matplotlib.pyplot as plt
ages = [5,7,8,7,2,17,2,9,4,11,12,9,6]
plt.hist(ages, 3,rwidth=0.97)
plt.show()
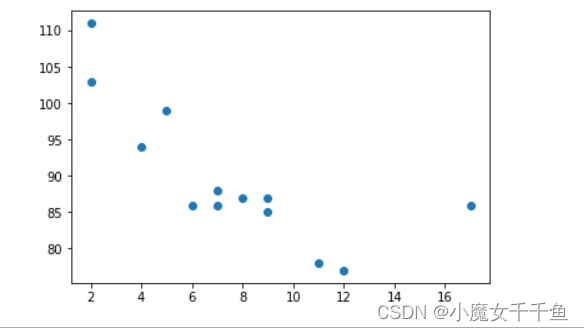
绘制散点图
散点图是数据集中的每个值都由点表示的图.
#绘制年龄和速度散点图
import matplotlib.pyplot as plt
age = [5,7,8,7,2,17,2,9,4,11,12,9,6]
speed = [99,86,87,88,111,86,103,87,94,78,77,85,86]
plt.scatter(age,speed)
plt.show()
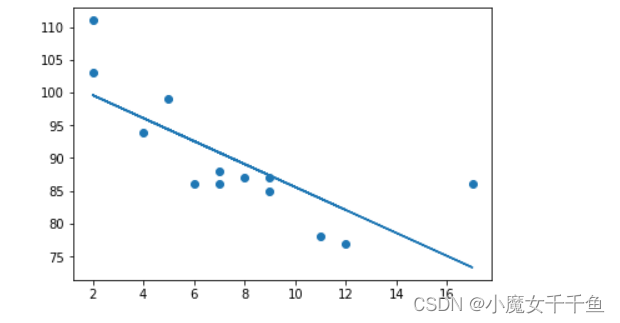
 通过看图发现数据的发展趋势是什么?(线性回归)
线性回归
import matplotlib.pyplot as plt
from scipy import stats
x = [5,7,8,7,2,17,2,9,4,11,12,9,6]
y = [99,86,87,88,111,86,103,87,94,78,77,85,86]
slope, intercept, r, p, std_err = stats.linregress(x, y)
def myfunc(x):
    return slope * x + intercept

mymodel = list(map(myfunc, x))
plt.scatter(x, y)
plt.plot(x, mymodel)
plt.show()
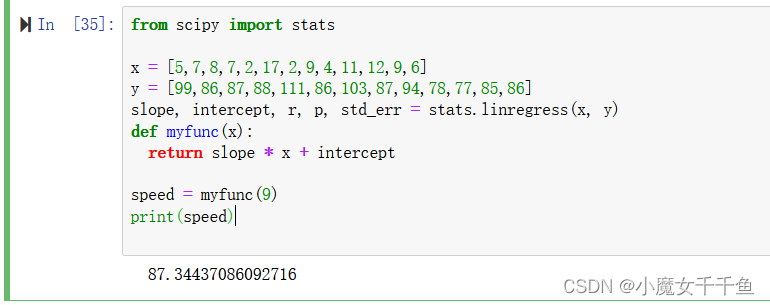
通过线性回归可以预测9年的车辆速度是多少?
from scipy import stats

x = [5,7,8,7,2,17,2,9,4,11,12,9,6]
y = [99,86,87,88,111,86,103,87,94,78,77,85,86]
slope, intercept, r, p, std_err = stats.linregress(x, y)
def myfunc(x):
  return slope * x + intercept

speed = myfunc(9)
print(speed)
x = [89,43,36,36,95,10,66,34,38,20,26,29,48,64,6,5,36,66,72,40]
y = [21,46,3,35,67,95,53,72,58,10,26,34,90,33,38,20,56,2,47,15]
x 和 y 轴的这些值将导致线性回归的拟合度非常差:
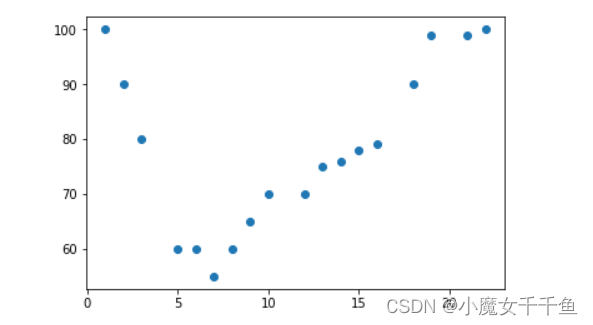
在下面的例子中,我们注册了 18 辆经过特定收费站的汽车。
我们已经记录了汽车的速度和通过时间(小时)。
import matplotlib.pyplot as plt
x = [1,2,3,5,6,7,8,9,10,12,13,14,15,16,18,19,21,22]
y = [100,90,80,60,60,55,60,65,70,70,75,76,78,79,90,99,99,100]
plt.scatter(x, y)
plt.show()
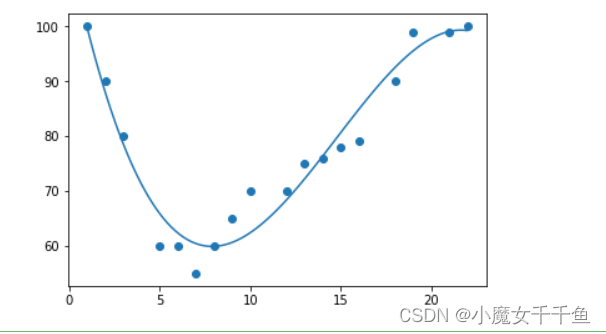
多项式回归
import numpy
import matplotlib.pyplot as plt
x = [1,2,3,5,6,7,8,9,10,12,13,14,15,16,18,19,21,22]
y = [100,90,80,60,60,55,60,65,70,70,75,76,78,79,90,99,99,100]
mymodel = numpy.poly1d(numpy.polyfit(x, y, 3))
myline = numpy.linspace(1, 22, 100)
plt.scatter(x, y)
plt.plot(myline, mymodel(myline))
plt.show()
 那怎么判断是否适合线性回归还是多项式回归呢?
拟合度
#线性回归拟合度
import numpy
from scipy import stats
x = [89,43,36,36,95,10,66,34,38,20,26,29,48,64,6,5,36,66,72,40]
y = [21,46,3,35,67,95,53,72,58,10,26,34,90,33,38,20,56,2,47,15]
slope, intercept, r, p, std_err = stats.linregress(x, y)
print(r)

#多项式回归拟合度
import numpy
from sklearn.metrics import r2_score
x = [1,2,3,5,6,7,8,9,10,12,13,14,15,16,18,19,21,22]
y = [100,90,80,60,60,55,60,65,70,70,75,76,78,79,90,99,99,100]
mymodel = numpy.poly1d(numpy.polyfit(x, y, 3))
print(r2_score(y, mymodel(x)))
