Harris 角点检测
目标
• 理解 Harris 角点检测的概念
• 学习函数:cv2.cornerHarris(),cv2.cornerSubPix()
原理
在上一节我们已经知道了角点的一个特性:向任何方向移动变化都很大。Chris_Harris 和 Mike_Stephens 早在 1988 年的文章《A Combined Corner and Edge Detector》中就已经提出了焦点检测的方法,被称为
Harris 角点检测。他把这个简单的想法转换成了数学形式。将窗口向各个方向移动(u,v)然后计算所有差异的总和。表达式如下:
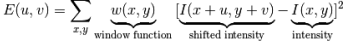
窗口函数可以是正常的矩形窗口也可以是对每一个像素给予不同权重的高斯窗口
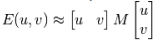
角点检测中要使 E (µ, ν) 的值最大。这就是说必须使方程右侧的第二项的取值最大。对上面的等式进行泰勒级数展开然后再通过几步数学换算(可以参考其他标准教材),我们得到下面的等式:
其中
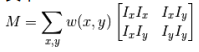
这里 I x {
{I}_{x}} Ix 和 I y {
{I}_{y}} Iy是图像在 x 和 y 方向的导数。(可以使用函数 cv2.Sobel()计算得到)。
然后就是主要部分了。他们根据一个用来判定窗口内是否包含角点的等式进行打分。
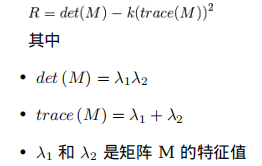
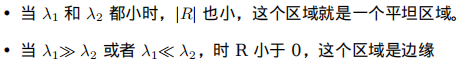
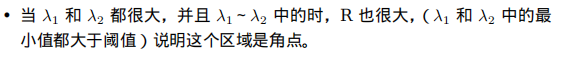
所以根据这些特征中我们可以判断一个区域是否是角点,边界或者是平面。
可以用下图来表示我们的结论:
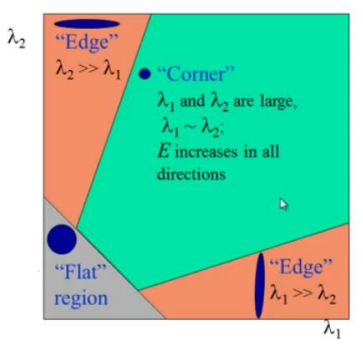
所以 Harris 角点检测的结果是一个由角点分数构成的灰度图像。选取适当的阈值对结果图像进行二值化我们就检测到了图像中的角点。我们将用一个简单的图片来演示一下。
OpenCV 中的 Harris 角点检测
Open 中的函数 cv2.cornerHarris() 可以用来进行角点检测。参数如
下:
• img - 数据类型为 float32 的输入图像。
• blockSize - 角点检测中要考虑的领域大小。
• ksize - Sobel 求导中使用的窗口大小
• k - Harris 角点检测方程中的自由参数,取值参数为 [0,04,0.06].
例子如下:
# -*- coding: utf-8 -*-
"""
Created on Mon Jan 20 18:53:24 2014
@author: duan
"""
import cv2
import numpy as np
filename = 'chessboard.jpg'
img = cv2.imread(filename)
gray = cv2.cvtColor(img,cv2.COLOR_BGR2GRAY)
gray = np.float32(gray)
# 输入图像必须是 float32,最后一个参数在 0.04 到 0.05 之间
dst = cv2.cornerHarris(gray,2,3,0.04)
#result is dilated for marking the corners, not important
dst = cv2.dilate(dst,None)
# Threshold for an optimal value, it may vary depending on the image.
img[dst>0.01*dst.max()]=[0,0,255]
cv2.imshow('dst',img)
if cv2.waitKey(0) & 0xff == 27:
cv2.destroyAllWindows()
结果如下:
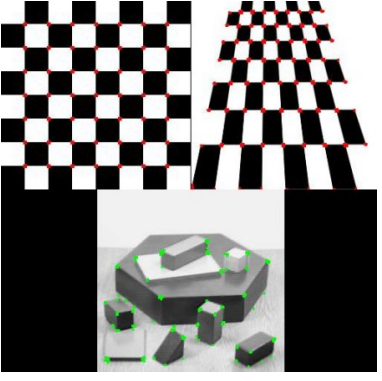
亚像素级精确度的角点
有时我们需要最大精度的角点检测。OpenCV 为我们提供了函数 cv2.cornerSubPix(),它可以提供亚像素级别的角点检测。下面是一个例子。首先我们要找到 Harris角点,然后将角点的重心传给这个函数进行修正。Harris 角点用红色像素标出,绿色像素是修正后的像素。在使用这个函数是我们要定义一个迭代停止条件。当迭代次数达到或者精度条件满足后迭代就会停止。我们同样需要定义进行角点搜索的邻域大小。
# -*- coding: utf-8 -*-
"""
Created on Mon Jan 20 18:55:47 2014
@author: duan
"""
import cv2
import numpy as np
filename = 'chessboard2.jpg'
img = cv2.imread(filename)
gray = cv2.cvtColor(img,cv2.COLOR_BGR2GRAY)
# find Harris corners
gray = np.float32(gray)
dst = cv2.cornerHarris(gray,2,3,0.04)
dst = cv2.dilate(dst,None)
ret, dst = cv2.threshold(dst,0.01*dst.max(),255,0)
dst = np.uint8(dst)
# find centroids
#connectedComponentsWithStats(InputArray image, OutputArray labels, OutputArray stats,
#OutputArray centroids, int connectivity=8, int ltype=CV_32S)
ret, labels, stats, centroids = cv2.connectedComponentsWithStats(dst)
# define the criteria to stop and refine the corners
criteria = (cv2.TERM_CRITERIA_EPS + cv2.TERM_CRITERIA_MAX_ITER, 100, 0.001)
#Python: cv2.cornerSubPix(image, corners, winSize, zeroZone, criteria)
#zeroZone – Half of the size of the dead region in the middle of the search zone
#over which the summation in the formula below is not done. It is used sometimes
# to avoid possible singularities of the autocorrelation matrix. The value of (-1,-1)
# indicates that there is no such a size.
# 返回值由角点坐标组成的一个数组(而非图像)
corners = cv2.cornerSubPix(gray,np.float32(centroids),(5,5),(-1,-1),criteria)
# Now draw them
res = np.hstack((centroids,corners))
#np.int0 可以用来省略小数点后面的数字(非四㮼五入)。
res = np.int0(res)
img[res[:,1],res[:,0]]=[0,0,255]
img[res[:,3],res[:,2]] = [0,255,0]
cv2.imwrite('subpixel5.png',img)
结果如下,为了方便查看我们对角点的部分进行了放大: