目录
使用卷积对数据进行平滑处理
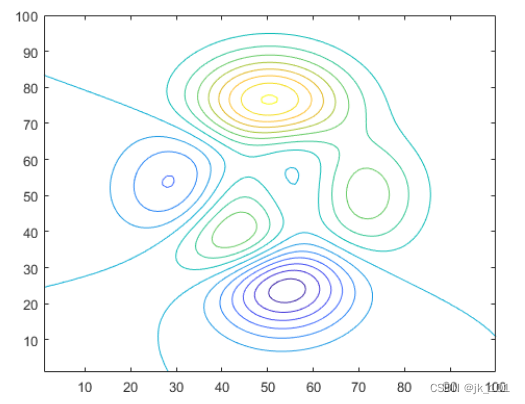
可以使用卷积对包含高频分量的二维数据进行平滑处理。使用 peaks 函数创建二维数据,并在各个等高线层级对数据绘图。
Z = peaks(100);
levels = -7:1:10;
contour(Z,levels)
如图所示:
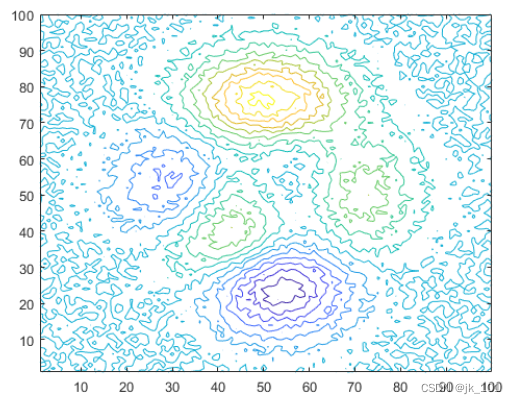
向数据中插入随机噪声并绘制含噪等高线。
Znoise = Z + rand(100) - 0.5;
contour(Znoise,levels)
如图所示:
MATLAB® 中的 conv2 函数使用指定的核求二维数据的卷积,该核的元素定义如何去除或增强原始数据的特征。核的大小不必与输入数据相同。小核足以对仅包含少数频率分量的数据进行平滑处理。较大的核可以更精确地对频率响应进行调整,从而得到更平滑的输出。
定义一个 3×3 核 K 并使用 conv2 对 Znoise 中的含噪数据进行平滑处理。绘制经过平滑处理的等高线。conv2 中的 'same' 选项使输出的大小与输入相同。
K = (1/9)*ones(3);
Zsmooth1 = conv2(Znoise,K,'same');
contour(Zsmooth1, levels)
如图所示:
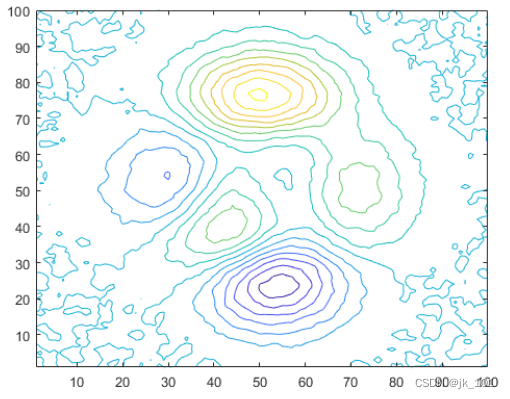
用 5×5 核对含噪数据进行平滑处理,并绘制新等高线。
K = (1/25)*ones(5);
Zsmooth2 = conv2(Znoise,K,'same');
contour(Zsmooth2,levels)
如图所示:

数据平滑和离群值检测
数据平滑指用于消除数据中不需要的噪声或行为的技术,而离群值检测用于标识与其余数据显著不同的数据点。
移动窗口方法
移动窗口方法是分批处理数据的方式,通常是为了从统计角度表示数据中的相邻点。移动平均值是一种常见的数据平滑技术,它沿着数据滑动窗,同时计算每个窗内点的均值。这可以帮助消除从一个数据点到下一个数据点的非显著变化。
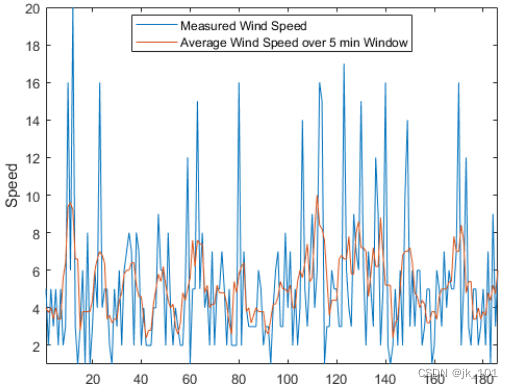
例如,假设每分钟测量一次风速,持续约 3 小时。使用 movmean 函数和 5 分钟的窗口大小可去除高速阵风。
load windData.mat
mins = 1:length(speed);
window = 5;
meanspeed = movmean(speed,window);
plot(mins,speed,mins,meanspeed)
axis tight
legend('Measured Wind Speed','Average Wind Speed over 5 min Window','location','best')
xlabel('Time')
ylabel('Speed')
如图所示:
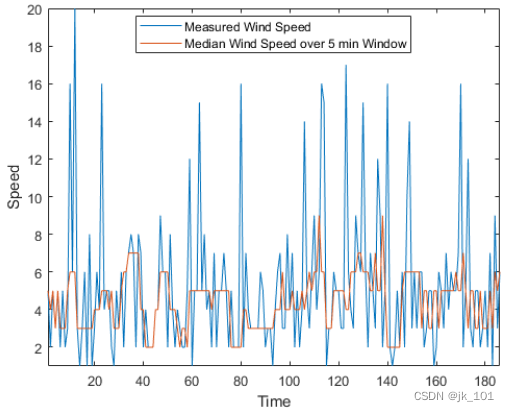
同样,可以使用 movmedian 函数计算滑动窗中的风速中位数。
medianspeed = movmedian(speed,window);
plot(mins,speed,mins,medianspeed)
axis tight
legend('Measured Wind Speed','Median Wind Speed over 5 min Window','location','best')
xlabel('Time')
ylabel('Speed')
如图所示:
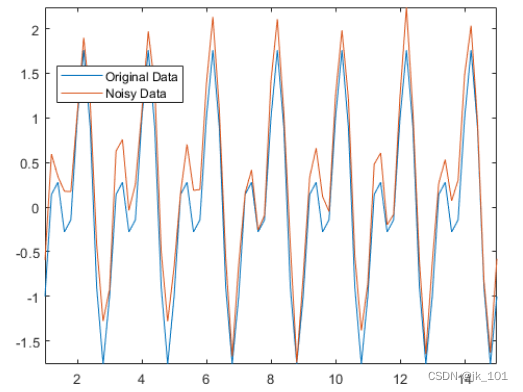
并非所有数据都适合用移动窗口方法进行平滑处理。例如,创建插入了随机噪声的正弦信号。
t = 1:0.2:15;
A = sin(2*pi*t) + cos(2*pi*0.5*t);
Anoise = A + 0.5*rand(1,length(t));
plot(t,A,t,Anoise)
axis tight
legend('Original Data','Noisy Data','location','best')
如图所示:
使用移动均值和大小为 3 的窗口对含噪数据进行平滑处理。
window = 3;
Amean = movmean(Anoise,window);
plot(t,A,t,Amean)
axis tight
legend('Original Data','Moving Mean - Window Size 3')
如图所示:

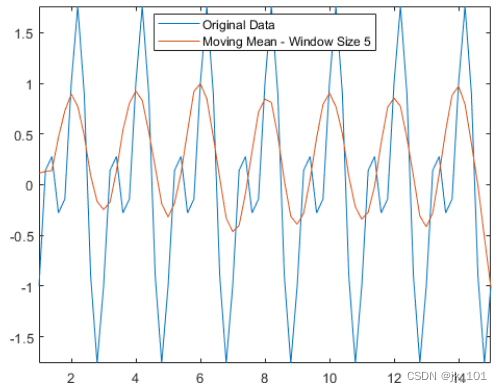
移动均值方法可获得数据的大致形状,但不能非常准确地捕获波谷(局部最小值)。由于波谷点在每个窗口中两个较大的邻点之间,因此均值不是那些点的理想近似值。如果使窗口大小变大,均值将完全消除较短的波峰。对于这种类型的数据,您可能需要考虑其他平滑技术。
Amean = movmean(Anoise,5);
plot(t,A,t,Amean)
axis tight
legend('Original Data','Moving Mean - Window Size 5','location','best')
如图所示:
常见的平滑方法
smoothdata 函数提供几种平滑选项,如 Savitzky-Golay 方法,这是一种常用的信号处理平滑技术。默认情况下,smoothdata 根据数据为方法选择最佳估计窗口大小。
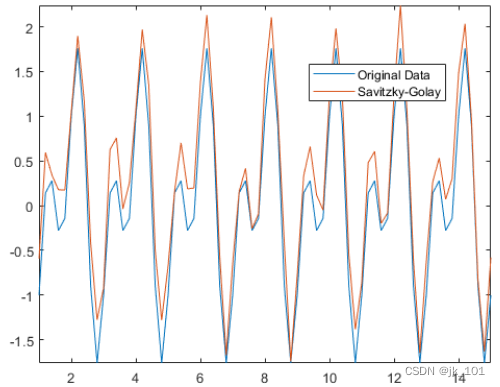
使用 Savitzky-Golay 方法可对含噪信号 Anoise 进行平滑处理,并输出它使用的窗口大小。与 movmean 相比,该方法可提供更好的波谷近似值。
[Asgolay,window] = smoothdata(Anoise,'sgolay');
plot(t,A,t,Asgolay)
axis tight
legend('Original Data','Savitzky-Golay','location','best')
如图所示:
window
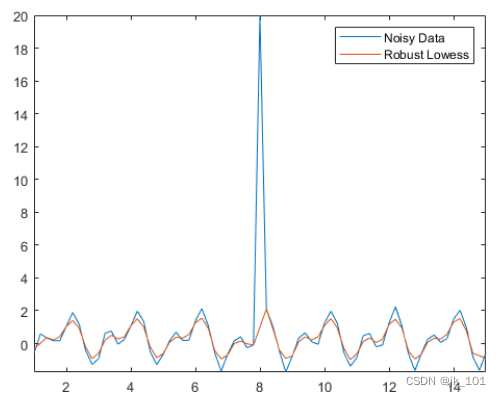
window = 3稳健的 Lowess 方法是另一种平滑方法,尤其适用于含噪数据还包含离群值的情形。在含噪数据中插入离群值,并使用稳健的 Lowess 方法对数据进行平滑处理,从而消除离群值。
Anoise(36) = 20;
Arlowess = smoothdata(Anoise,'rlowess',5);
plot(t,Anoise,t,Arlowess)
axis tight
legend('Noisy Data','Robust Lowess')
如图所示:
检测离群值
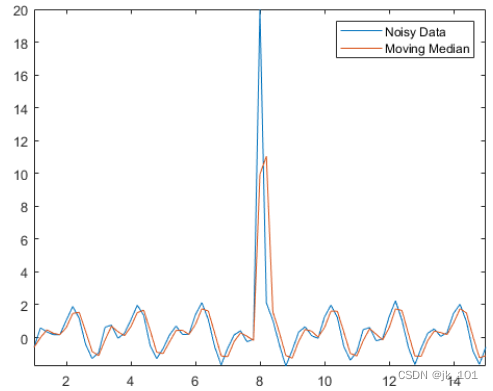
数据中的离群值可能使数据处理结果和其他计算量严重失真。例如,如果尝试用移动平均值方法对包含离群值的数据进行平滑处理,则可能得到误导性的波峰或波谷。
Amedian = smoothdata(Anoise,'movmedian');
plot(t,Anoise,t,Amedian)
axis tight
legend('Noisy Data','Moving Median')
如图所示:
当检测到离群值时,isoutlier 函数返回逻辑值 1。验证 Anoise 中离群值的索引和值。
TF = isoutlier(Anoise);
ind = find(TF)
ind = 36
Aoutlier = Anoise(ind)
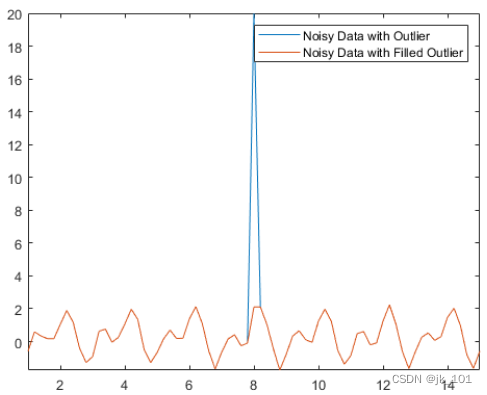
Aoutlier = 20可以使用 filloutliers 函数通过指定填充方法来替换数据中的离群值。例如,用紧挨 Anoise 中离群值右侧的邻点值填充该离群值。
Afill = filloutliers(Anoise,'next');
plot(t,Anoise,t,Afill)
axis tight
legend('Noisy Data with Outlier','Noisy Data with Filled Outlier')
如图所示:
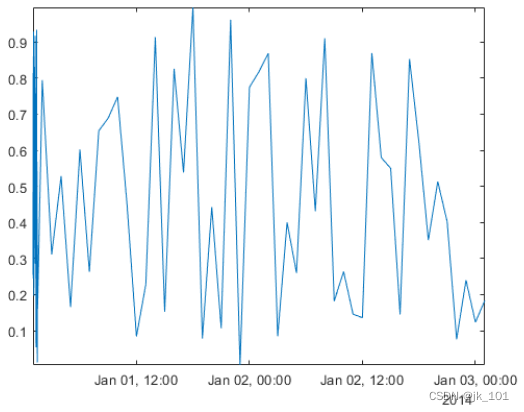
非均匀数据
并非所有数据都由等间距点组成,这会影响数据处理的方法。创建一个 datetime 向量,其中包含 Airreg 中数据的不规则采样时间。time 向量表示了前 30 分钟内每分钟采集一次的样本和两天内每小时采集一次的样本。
t0 = datetime(2014,1,1,1,1,1);
timeminutes = sort(t0 + minutes(1:30));
timehours = t0 + hours(1:48);
time = [timeminutes timehours];
Airreg = rand(1,length(time));
plot(time,Airreg)
axis tight
如图所示:
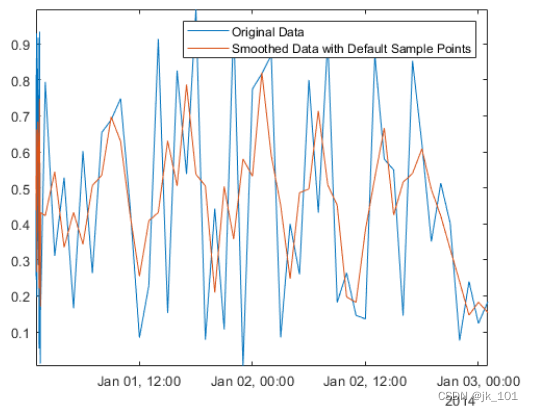
默认情况下,smoothdata 按照等间距整数进行平滑处理,在本例中为 1,2,...,78。由于整数时间戳与 Airreg 中各点的采样不协调,前半小时的数据在平滑后仍然出现噪声。
Adefault = smoothdata(Airreg,'movmean',3);
plot(time,Airreg,time,Adefault)
axis tight
legend('Original Data','Smoothed Data with Default Sample Points')
如图所示:
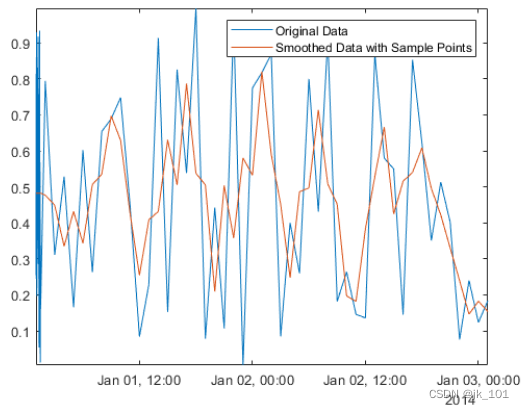
MATLAB® 中的许多数据处理函数(包括 smoothdata、movmean 和 filloutliers)允许提供样本点,从而确保相对于其采样单位和频率处理数据。要消除 Airreg 中前半小时数据的高频变化,请将 'SamplePoints' 选项和 time 中的时间戳结合使用。
Asamplepoints = smoothdata(Airreg,'movmean',hours(3),'SamplePoints',time);
plot(time,Airreg,time,Asamplepoints)
axis tight
legend('Original Data','Smoothed Data with Sample Points')
如图所示: