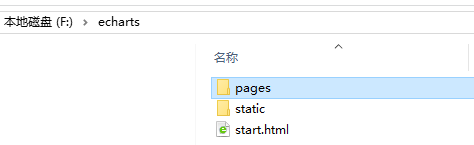
1、工程目录
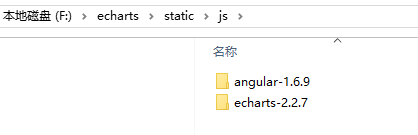
2、js引用
3、js编辑
var app = angular.module('app', []);
app.controller('pieCtrl', function($scope) {
$scope.legend = ["AAA", "BBB", "CCC", "DDD"];
$scope.data = [{value:12, name:'AAA'},{value:56,name:'BBB'},{value:89,name:'CCC'},{value:32,name:'DDD'}];
var myChart = echarts.init(document.getElementById('pie-wrap'));
var a = [];
var option = {
title:{
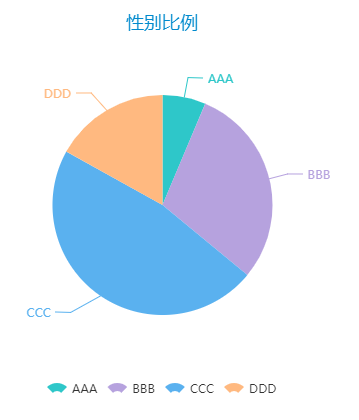
text : '性别比例',//标题说明
x:'center'//居中
},
// 提示框,鼠标悬浮交互时的信息提示
tooltip: {
show: true,
formatter: "{a} <br/>{b} : {c} ({d}%)"
},
// 图例
legend: {
x : 'center',
y : 'bottom',
data: $scope.legend
},
// 数据内容数组
series: [
{ name: '',
type: 'pie',
radius: "55%",
center: ['50%','50%'],
label: {normal: {position: 'inner'}}, //内置文本标签
labelLine: { normal: {show: false } },
data: function(){ var serie=[];
for(var i=0;i<$scope.legend.length;i++){
var item = {name : $scope.legend[i],type : 'pie', value : $scope.data[i].value};
serie.push(item);
}
return serie;}(),
itemStyle : { normal: { label: {show: true },
labelLine: {show: true }
} ,
emphasis: { label: {show: true, position: 'outer'},
labelLine: {show: true, lineStyle: {color: 'red'}}
}
}
}
]
};
myChart.setOption(option);
});
4、html编辑
<!DOCTYPE html PUBLIC "-//W3C//DTD XHTML 1.0 Transitional//EN" "http://www.w3.org/TR/xhtml1/DTD/xhtml1-transitional.dtd">
<html xmlns="http://www.w3.org/1999/xhtml">
<head>
<meta http-equiv="Content-Type" content="text/html; charset=utf-8" />
<title>饼形图</title>
<!--加载AngularJS-->
<script src="../static/js/angular-1.6.9/angular.js"></script>
<!--加载ECharts-->
<script src="../static/js/echarts-2.2.7/build/dist/echarts-all.js"></script>
<script src="../static/app/pieChartModule.js"></script>
</head>
<body ng-app="app" ng-controller="pieCtrl">
<div id="pie-wrap" style="height: 500px;" /><!-- 这里以后是地图 -->
</body>
</html>
5、效果图