前言
之前有小伙伴问道,能否复现一篇关于微生物多样性文献里的图片,今天小编给大家分享一下微生物分析相关的画图方法。这篇文献《Diversity and predictive metabolic pathways of the prokaryotic microbial community along a groundwater salinity gradient of the Pearl River Delta, China》旨在研究珠三角地区地下水的微生物群落结构。
期刊名称:scientificreports
项目类型:微生物多样性
图片复现
登陆TUTU网站(https://www.cloudtutu.com/),输入账号密码(已填好),输入验证码即可登陆。点击“全部工具”,找到相应分析即可作图!
1.文献中所用的方法
数据库:Silva16SrRNA数据库
软件:
①Mothur软件进行Alpha多样性分析。
②利用微生物生态学定量洞察(Qiime1.7.0)的层次聚类和主坐标分析(PCoA)进行地下水样品的beta多样性分析。
③使用SPSS software (IBM Corp., Armonk, NY, USA)软件进行等级相关分析。
④CANOCO4.5软件进行冗余分析(RDA)。
⑤R绘制相关性热图。
⑥采用线性判别分析(LDA)评估每个微生物分类群的差异,进行Kruskal-Wallis检验,以确定海水和淡水之间的显著差异。
⑦通过重建未观察状态(PICRUST)对群落进行系统发育调查,对OTU序列进行归一化,并与KEGG数据库进行比较,以进行功能预测分析。
2.Alpha多样性
文献:
通过聚类和比对,基于97%阈值获得984个微生物OTUs,范围为364-634OTUs,表明采样点间微生物OTU数量存在显著差异。
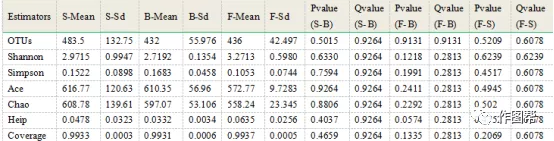
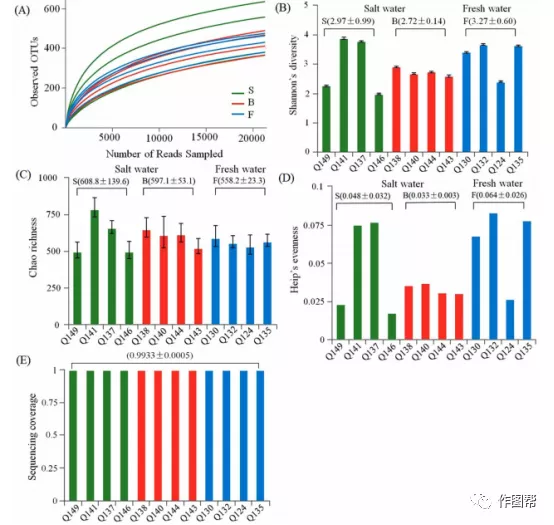
Figure 1. Te calculated α-diversity indices of freshwater (F), brackish water (B) and saline water (S): (A) the rarefaction curves and the number of the observed OTUs. (B) Shannon’s diversity. © Chao richness. (D) Heip’s evenness. (E) Sequencing coverage. Te numbers in parentheses are the mean and standard deviation. For more specifc data of the α-diversity indices, please refer to Supplementary Table S1.
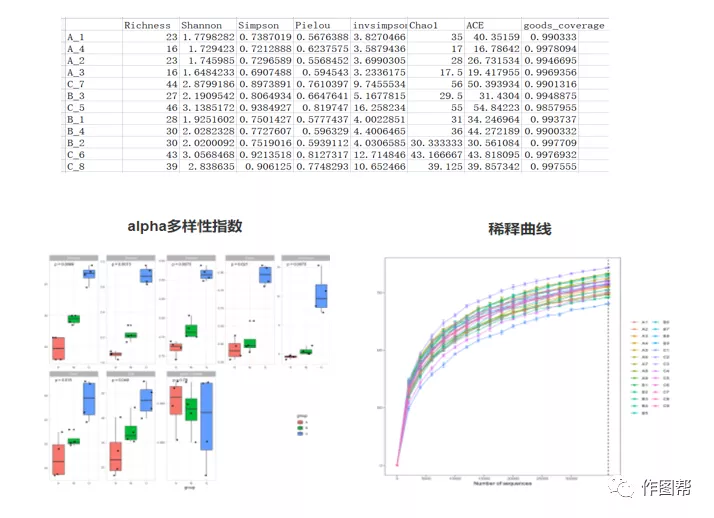
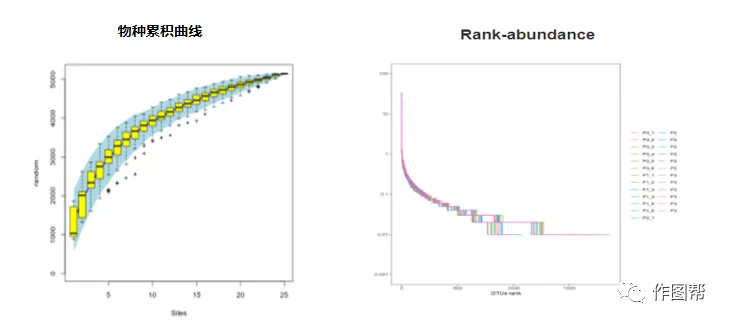
TUTUCLOUD(https://www.cloudtutu.com/):
微生物多样性指数:表格、箱线图以及稀释曲线
2.Beta多样性
文献:
根据未加权的距离确定了地下水样品的beta多样性:聚类树、主坐标分析(PCoA)。
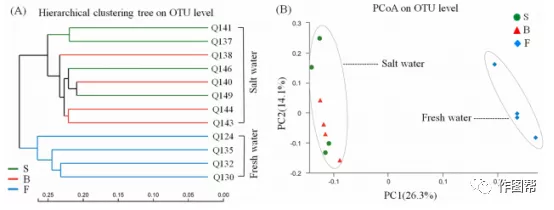
Figure 2. Beta diversity of saltwater and freshwater samples: (A) Hierarchical clustering tree on the OTU level based on the unweighted-unifrac distance. (B) Principal co-ordinates analysis (PCoA) on the OTU level based on the unweighted-unifrac distance.
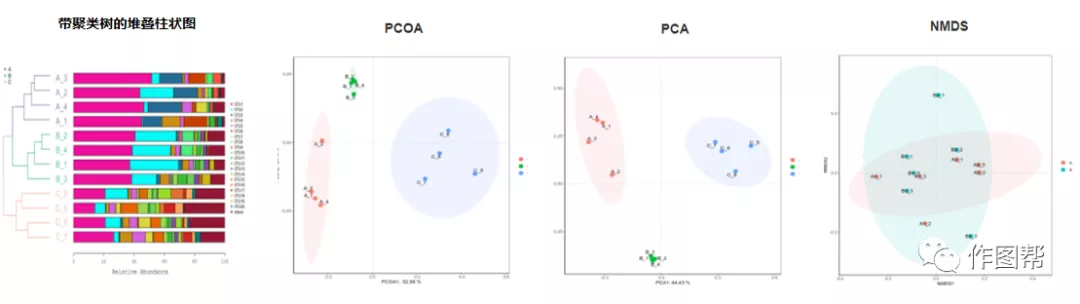
TUTUCLOUD(https://www.cloudtutu.com/):
带聚类树的堆叠柱状图、PCA、PCoA、NMDS
3.微生物群落的分类学组成
文献:
采用RDP分类算法对Silva16SrRNA数据库进行分析,合并阈值为70%,聚类为两个类群,包括44个门、95个目、174个目、267个科和420个属。用堆叠柱状图展示门、纲和属水平的地下水微生物群落的分类学组成情况(相对丰度>为2%)(Figure 3A-3C)。此外还对微生物群落和主要环境因素进行了冗余分析(RDA)(Figure 3D-F)。
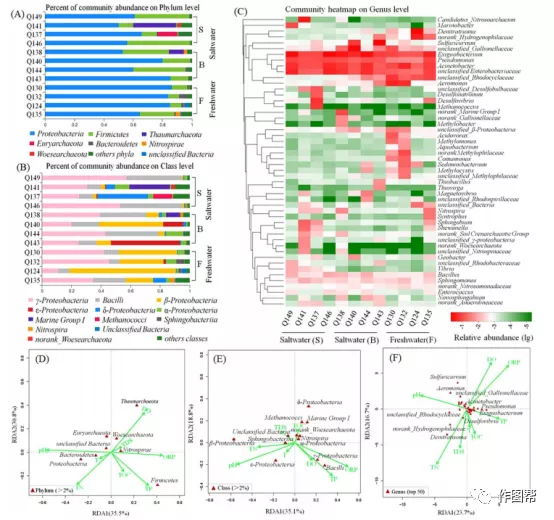
Figure 3. Microbial community composition of the groundwater samples studied (A) at the phylum level (relative abundance >2%), (B) at the class level (relative abundance >2%) and © at the genus level (top 50). (D–F) Show the RDA analysis of these microbial biocenoses and environmental parameters.
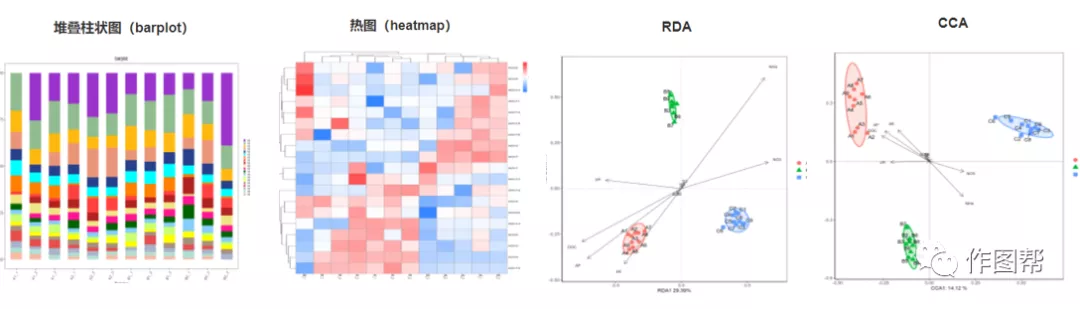
TUTUCLOUD(https://www.cloudtutu.com/):
堆叠柱状图、热图、RDA、CCA分析
4.差异分析
文献:
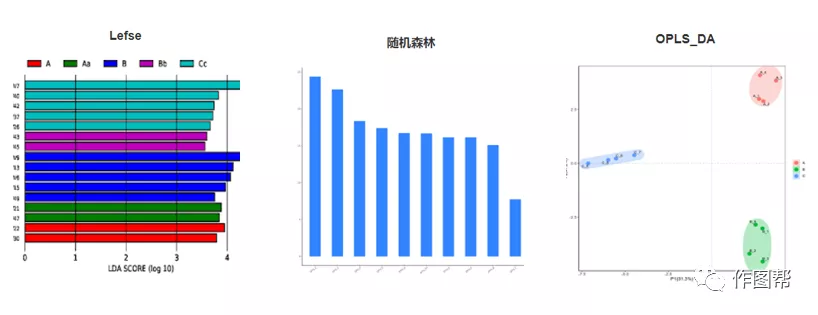
利用LEfSe进行生物标志物分析,以确定海水和淡水之间微生物丰度的显著差异。

Supplementary** Fig. S3 **Assessment of the difference in microbial abundance between the saltwater and freshwater samples using the LEfSe method. (A) The cladogram of the microbial taxa, from the phylum down to the genus levels. Green indicates the taxa enriched in saline water samples (S), and blue indicates the taxa enriched in fresh water samples (F). Brackish water samples (B) have no microbiota taxa identified; (B) The effect on the size of the difference was calculated by the linear discriminant analysis between saltwater and freshwater samples with a threshold value of 4.0. Green indicates saline water samples (S), and blue indicates fresh water samples (F); © The Kruskal-Wallis Test was used to calculate the microbial abundance with significant differences at the phylum, class, order, family, and genus level. Green indicates the taxa enriched in the saline water samples (S); red indicates the taxa enriched in the brackish water samples (B) and blue indicates the taxa enriched in fresh water samples (F) (*P<0.05, **P<0.01).
TUTUCLOUD(https://www.cloudtutu.com/):
LDA值柱状图、随机森林、OPLS_DA分析
5.功能预测
文献:
基于KEGG同源基团,对12个地下水样本的微生物群落的功能谱进行了预测。
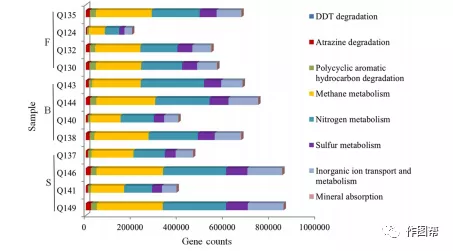
Figure 4. Te relative abundance of some predicted functional profles in the groundwater samples examined based on KEGG orthologous groups.
TUTUCLOUD(https://www.cloudtutu.com/):
这个图其实就是横向的柱状图,前文有提到过哦~
6.文献结论
在这项研究中,结果表明微生物群落组成随含水层盐度的不同而显著不同,古海水的影响一直持续到了今天。预测宏基因组分析显示,所研究的地下水样品中存在的代谢途径包括农药和难降解有机物质(二氯二苯基三氯乙烷(DDT)、阿特拉津和多环芳烃)、物质的降解循环(甲烷、氮和硫)、无机离子和矿物代谢物。此研究结果有助于加深我们对微生物组合的组成及其在受咸水入侵污染的含水层中作为环境指标的意义的理解。
7.参考文献
- Lu, Q., Li, C. & Li, T. Overview of groundwater pollution in China. Chinese Journal of Industrial hygiene and occupational diseases(In Chinese) 24, 317–320 (2006).
- Qi, S. & Qiu, Q. Environmental hazard from saltwater intrusion in the Laizhou Gulf, Shandong Province of China. Nat Hazards 56,563–566 (2011).
- Goldscheider, N., Hunkeler, D. & Rossi, P. Review: Microbial biocenoses in pristine aquifers and an assessment of investigativemethods. Hydrogeol J 14, 926–941 (2006).
- Humphreys, W. F. Hydrogeology and groundwater ecology: Does each inform the other? Hydrogeol J 17, 5–21 (2009).
- Hancock, P. J., Boulton, A. J. & Humphreys, W. F. Aquifers and hyporheic zones: Towards an ecological understanding of groundwater. Hydrogeol J 13, 98–111 (2005).