Camera
- 相机
from jetcam.csi_camera import CSICamera
# from jetcam.usb_camera import USBCamera
camera = CSICamera(width=224, height=224)
# camera = USBCamera(width=224, height=224)
camera.running = True
- 插入CSI摄像头
Task
- 任务
import torchvision.transforms as transforms
from xy_dataset import XYDataset
TASK = 'road_following'
CATEGORIES = ['apex']
DATASETS = ['A', 'B']
TRANSFORMS = transforms.Compose([
transforms.ColorJitter(0.2, 0.2, 0.2, 0.2),
transforms.Resize((244, 244)),
transforms.ToTensor(),
transforms.Normalize([0.485, 0.456, 0.406], [0.229, 0.224, 0.225])
])
datasets = {
}
for name in DATASETS:
datasets[name] = XYDataset(TASK + '_' + name, CATEGORIES, TRANSFORMS, random_hflip=True)
- 设置任务
DATASETS是数据集名称列表;
datasets是数据集字典;
XYDataset是XY数据集的一个已定义的类,参数由该数据集名称,CATEGORIES类别列表,TRANSFORMS语法转化规则,random_hflip随机翻转组成。
Data Collection
- 数据收集
import cv2
import ipywidgets
import traitlets
from IPython.display import display
from jetcam.utils import bgr8_to_jpeg
from jupyter_clickable_image_widget import ClickableImageWidget
# initialize active dataset
dataset = datasets[DATASETS[0]]
# unobserve all callbacks from camera in case we are running this cell for second time
camera.unobserve_all()
# create image preview
camera_widget = ClickableImageWidget(width=camera.width, height=camera.height)
snapshot_widget = ipywidgets.Image(width=camera.width, height=camera.height)
traitlets.dlink((camera, 'value'), (camera_widget, 'value'), transform=bgr8_to_jpeg)
# create widgets
dataset_widget = ipywidgets.Dropdown(options=DATASETS, description='dataset')
category_widget = ipywidgets.Dropdown(options=dataset.categories, description='category')
count_widget = ipywidgets.IntText(description='count')
# manually update counts at initialization
count_widget.value = dataset.get_count(category_widget.value)
# sets the active dataset
def set_dataset(change):
global dataset
dataset = datasets[change['new']]
count_widget.value = dataset.get_count(category_widget.value)
dataset_widget.observe(set_dataset, names='value')
# update counts when we select a new category
def update_counts(change):
count_widget.value = dataset.get_count(change['new'])
category_widget.observe(update_counts, names='value')
def save_snapshot(_, content, msg):
if content['event'] == 'click':
data = content['eventData']
x = data['offsetX']
y = data['offsetY']
# save to disk
dataset.save_entry(category_widget.value, camera.value, x, y)
# display saved snapshot
snapshot = camera.value.copy()
snapshot = cv2.circle(snapshot, (x, y), 8, (0, 255, 0), 3)
snapshot_widget.value = bgr8_to_jpeg(snapshot)
count_widget.value = dataset.get_count(category_widget.value)
camera_widget.on_msg(save_snapshot)
data_collection_widget = ipywidgets.VBox([
ipywidgets.HBox([camera_widget, snapshot_widget]),
dataset_widget,
category_widget,
count_widget
])
display(data_collection_widget)
- 运行结果:

运行出来后可以选择数据集A或者B,category仅可使用apex,count值为数据集A中存在的数据量。
可以看到左边的图片是摄像头实时的情况,右边的图片显示异常,其实只要在左边的图片中点击小车前进的理想点之后,右边的图片就会显示出你点击的理想点及当时场景,这样一来,你就得到了一个标记的数据。
Model
- 模型
import torch
import torchvision
device = torch.device('cuda')
output_dim = 2 * len(dataset.categories) # x, y coordinate for each category
# ALEXNET
# 经典神经网络实例
# model = torchvision.models.alexnet(pretrained=True)
# model.classifier[-1] = torch.nn.Linear(4096, output_dim)
# SQUEEZENET
# 物品分类
# model = torchvision.models.squeezenet1_1(pretrained=True)
# model.classifier[1] = torch.nn.Conv2d(512, output_dim, kernel_size=1)
# model.num_classes = len(dataset.categories)
# RESNET 18
# 残差网络 18
model = torchvision.models.resnet18(pretrained=True)
model.fc = torch.nn.Linear(512, output_dim)
# RESNET 34
# 残差网络 34
# model = torchvision.models.resnet34(pretrained=True)
# model.fc = torch.nn.Linear(512, output_dim)
# DENSENET 121
# Dense卷积网络
# model = torchvision.models.densenet121(pretrained=True)
# model.classifier = torch.nn.Linear(model.num_features, output_dim)
model = model.to(device)
model_save_button = ipywidgets.Button(description='save model')
model_load_button = ipywidgets.Button(description='load model')
model_path_widget = ipywidgets.Text(description='model path', value='road_following_model.pth')
def load_model(c):
model.load_state_dict(torch.load(model_path_widget.value))
model_load_button.on_click(load_model)
def save_model(c):
torch.save(model.state_dict(), model_path_widget.value)
model_save_button.on_click(save_model)
model_widget = ipywidgets.VBox([
model_path_widget,
ipywidgets.HBox([model_load_button, model_save_button])
])
display(model_widget)
- 运行结果:
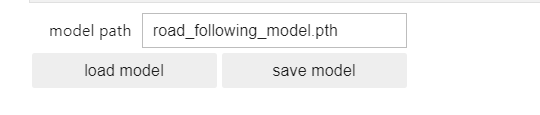
是一个模型路径选择的widget。
Live Execution
- 实时执行
import threading
import time
from utils import preprocess
import torch.nn.functional as F
state_widget = ipywidgets.ToggleButtons(options=['stop', 'live'], description='state', value='stop')
prediction_widget = ipywidgets.Image(format='jpeg', width=camera.width, height=camera.height)
def live(state_widget, model, camera, prediction_widget):
global dataset
while state_widget.value == 'live':
image = camera.value
preprocessed = preprocess(image)
output = model(preprocessed).detach().cpu().numpy().flatten()
category_index = dataset.categories.index(category_widget.value)
x = output[2 * category_index]
y = output[2 * category_index + 1]
x = int(camera.width * (x / 2.0 + 0.5))
y = int(camera.height * (y / 2.0 + 0.5))
prediction = image.copy()
prediction = cv2.circle(prediction, (x, y), 8, (255, 0, 0), 3)
prediction_widget.value = bgr8_to_jpeg(prediction)
def start_live(change):
if change['new'] == 'live':
execute_thread = threading.Thread(target=live, args=(state_widget, model, camera, prediction_widget))
execute_thread.start()
state_widget.observe(start_live, names='value')
live_execution_widget = ipywidgets.VBox([
prediction_widget,
state_widget
])
display(live_execution_widget)
最后是epochs,epochs,train,loss等功能或其数值操作显示部件。
BATCH_SIZE = 8
optimizer = torch.optim.Adam(model.parameters())
# optimizer = torch.optim.SGD(model.parameters(), lr=1e-3, momentum=0.9)
epochs_widget = ipywidgets.IntText(description='epochs', value=1)
eval_button = ipywidgets.Button(description='evaluate')
train_button = ipywidgets.Button(description='train')
loss_widget = ipywidgets.FloatText(description='loss')
progress_widget = ipywidgets.FloatProgress(min=0.0, max=1.0, description='progress')
def train_eval(is_training):
global BATCH_SIZE, LEARNING_RATE, MOMENTUM, model, dataset, optimizer, eval_button, train_button, accuracy_widget, loss_widget, progress_widget, state_widget
try:
train_loader = torch.utils.data.DataLoader(
dataset,
batch_size=BATCH_SIZE,
shuffle=True
)
state_widget.value = 'stop'
train_button.disabled = True
eval_button.disabled = True
time.sleep(1)
if is_training:
model = model.train()
else:
model = model.eval()
while epochs_widget.value > 0:
i = 0
sum_loss = 0.0
error_count = 0.0
for images, category_idx, xy in iter(train_loader):
# send data to device
images = images.to(device)
xy = xy.to(device)
if is_training:
# zero gradients of parameters
optimizer.zero_grad()
# execute model to get outputs
outputs = model(images)
# compute MSE loss over x, y coordinates for associated categories
loss = 0.0
for batch_idx, cat_idx in enumerate(list(category_idx.flatten())):
loss += torch.mean((outputs[batch_idx][2 * cat_idx:2 * cat_idx+2] - xy[batch_idx])**2)
loss /= len(category_idx)
if is_training:
# run backpropogation to accumulate gradients
loss.backward()
# step optimizer to adjust parameters
optimizer.step()
# increment progress
count = len(category_idx.flatten())
i += count
sum_loss += float(loss)
progress_widget.value = i / len(dataset)
loss_widget.value = sum_loss / i
if is_training:
epochs_widget.value = epochs_widget.value - 1
else:
break
except e:
pass
model = model.eval()
train_button.disabled = False
eval_button.disabled = False
state_widget.value = 'live'
train_button.on_click(lambda c: train_eval(is_training=True))
eval_button.on_click(lambda c: train_eval(is_training=False))
train_eval_widget = ipywidgets.VBox([
epochs_widget,
progress_widget,
loss_widget,
ipywidgets.HBox([train_button, eval_button])
])
display(train_eval_widget)
All together!
- 总结
The following widget can be used to label a multi-class x, y dataset. It supports labeling only one instance of each class per image (ie: only one dog), but multiple classes (ie: dog, cat, horse) per image are possible.
- 下面的小部件可以用来标记一个多类x, y数据集。它只支持为每个图像的每个类标记一个实例(即:只有一只狗),但是每个图像可能有多个类(即:狗,猫,马)。
Click the image on the top left to save an image of category to dataset at the clicked location.
- 单击左上角的图像,在单击的位置将类别图像保存到数据集。
| Widget | Description |
|---|---|
| dataset | Selects the active dataset |
| category | Selects the active category |
| epochs | Sets the number of epochs to train for |
| train | Trains on the active dataset for the number of epochs specified |
| evaluate | Evaluates the accuracy on the active dataset over one epoch |
| model path | Sets the active model path |
| load | Loads a model from the active model path |
| save | Saves a model to the active model path |
| stop | Disables the live demo |
| live | Enables the live demo |
| 部件 | 描述 |
|---|---|
| dataset | 选择活动数据集 |
| category | 选择活动类别 |
| epochs | 设定要训练的迭代数 |
| train | 在活动数据集上训练指定的纪元数目 |
| evaluate | 评估活动数据集在一个历元上的精度 |
| model path | 设置活动模型路径 |
| load | 从活动模型路径加载模型 |
| save | 将模型保存到活动模型路径 |
| stop | 禁用现场演示 |
| live | 开启现场演示 |
将所有部件统一运行显示在下面
all_widget = ipywidgets.VBox([
ipywidgets.HBox([data_collection_widget, live_execution_widget]),
train_eval_widget,
model_widget
])
display(all_widget)
-
运行结果:

-
左边图片为小车摄像头的实时画面;中间的图片会在点击小车前进的理想位置后显示出标记位置;最右侧图片在选择状态为live后显示出当前小车判断的前进位置。
1、该数据采集程序退出后,重新打开摄像头可能出现摄像头被占用的出错提示,重启摄像头请在命令行运行下面的命令:
sudo systemctl restart nvargus-daemon
2、直接运行程序后,对最后一整个部件进行操作即可,上面的部件不必进行操作。
3、程序运行到最后,此时可以将小车放到赛道上,同时打开上一节teleoperation.ipynb程序运行,使遥控手柄可以控制小车运动。
4、控制小车沿着赛道运行,每移动一小段位置,就用鼠标移动到图片中小车理想的运行路径上点击一下保存图片,控制小车沿着赛道拍摄10圈(圈数不固定,照片数量足够即可)。
5、采集好数据后,将epochs的值选择为10,然后点击train,训练10轮。
6、训练好数据后可以点击evaluate 评估训练模型,如果采集的数据没有问题,可以在最左边的图像中看到当前小车位置的理想方向。
7、注意采集的数据需将小车沿轨道移动到不同的位置,偏移和方向,尽可能沿理想路径的方向上选择最远的点保存,以保证小车不会离开轨道或碰撞物体。