使用Xdebug 配合PhpStorm进行PHP程序调试
1.下载Xdebug
1.1 访问 https://xdebug.org/wizard
将 php.ini 的全部信息复制到这个文本框中

就可以得到对应版本的xdebug 的版本。
1.2 将下载的 xdebug.dll 放到 自己对应的php/ext 目录中
我本机的为 C:\wamp64\bin\php\php7.2.18\ext

1.3 到 php.ini 中配置 Xdebug 的配置信息
[XDebug]
; 你的xdebug.dll 的位置
zend_extension="C:\wamp64\bin\php\php7.2.18\ext\php_xdebug.dll"
xdebug.profiler_append = 0
xdebug.profiler_enable = 1
xdebug.profiler_enable_trigger = 0
;记录debug信息
xdebug.profiler_output_dir ="C:\wamp64\xdebug"
xdebug.trace_output_dir ="C:\wamp64\xdebug"
xdebug.profiler_output_name = "cache.out.%t-%s"
xdebug.remote_enable = 1
xdebug.remote_handler = "dbgp"
xdebug.remote_host = "127.0.0.1"
;这里的端口关系到 phpStorm 中的配置
xdebug.remote_port = 9000
xdebug.remote_mode = "req"
xdebug.idekey = phpdebug
注意:我使用的集成环境是 Wampserver64 我防止错误 我在 Wampserver64中的php.ini 中也配置了以上的Xdebug 配置。

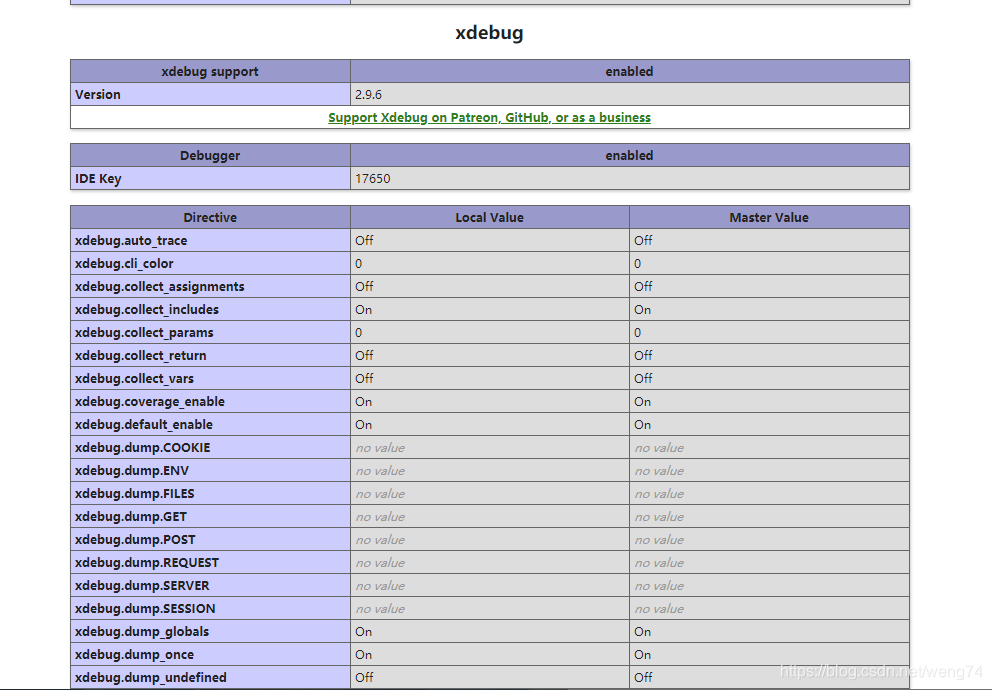
1.4 以上的配置完成 访问 loaclhost
出现这个就是配置成功了。
2.配置PhpStorm
看看这里的Debug port 是不是和配置中的 9000 相同 ,然后点击Apply。

扫描二维码关注公众号,回复:
12719904 查看本文章

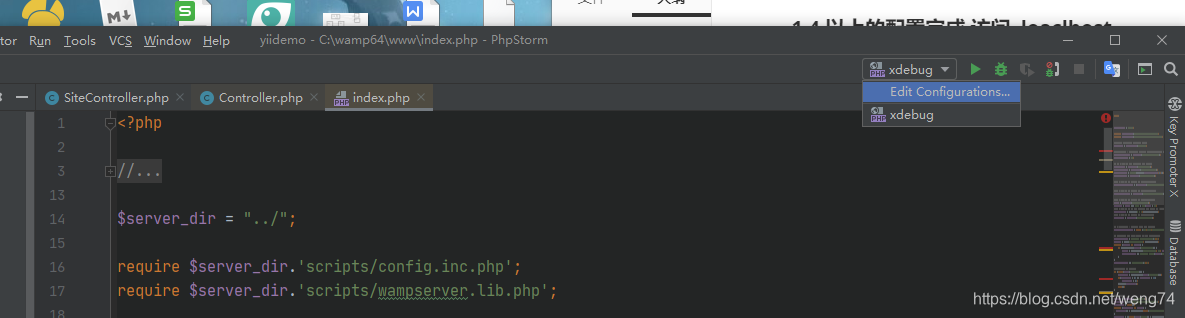
2.1 点击 Edit Config
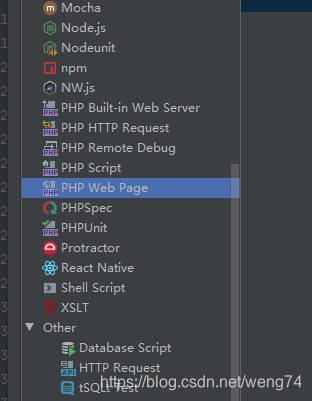
2.2 点击 PHP Web Page
2.3 配置Start URl
这里是你的项目的启动路径 比如 我有一个项目的 目录是test 我要访问 则 Start URL就配置 /test。
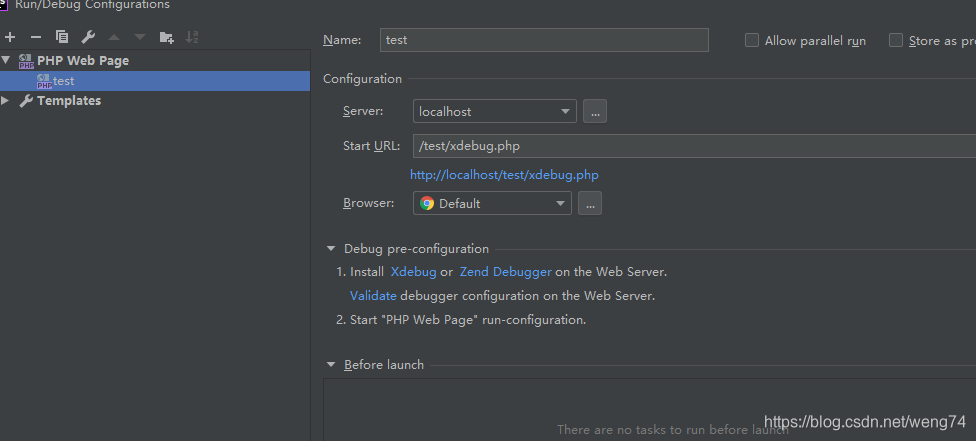
然后点击Server 旁边的…
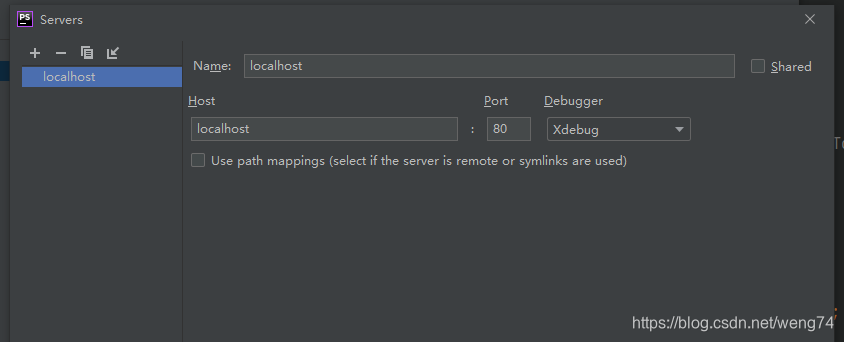
以上就配置好了 Php Storm 。
3.进行调试
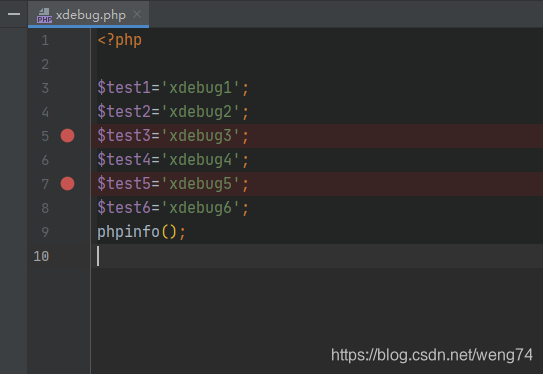
这里点击左边的空白格 打上断点。
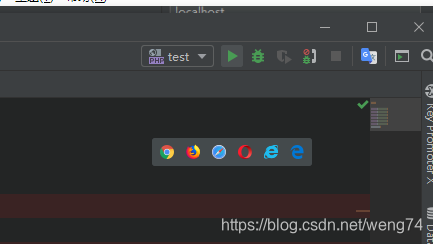
点击这个这个和电话一样的图标 ,再点击 这个绿色的小虫子 。
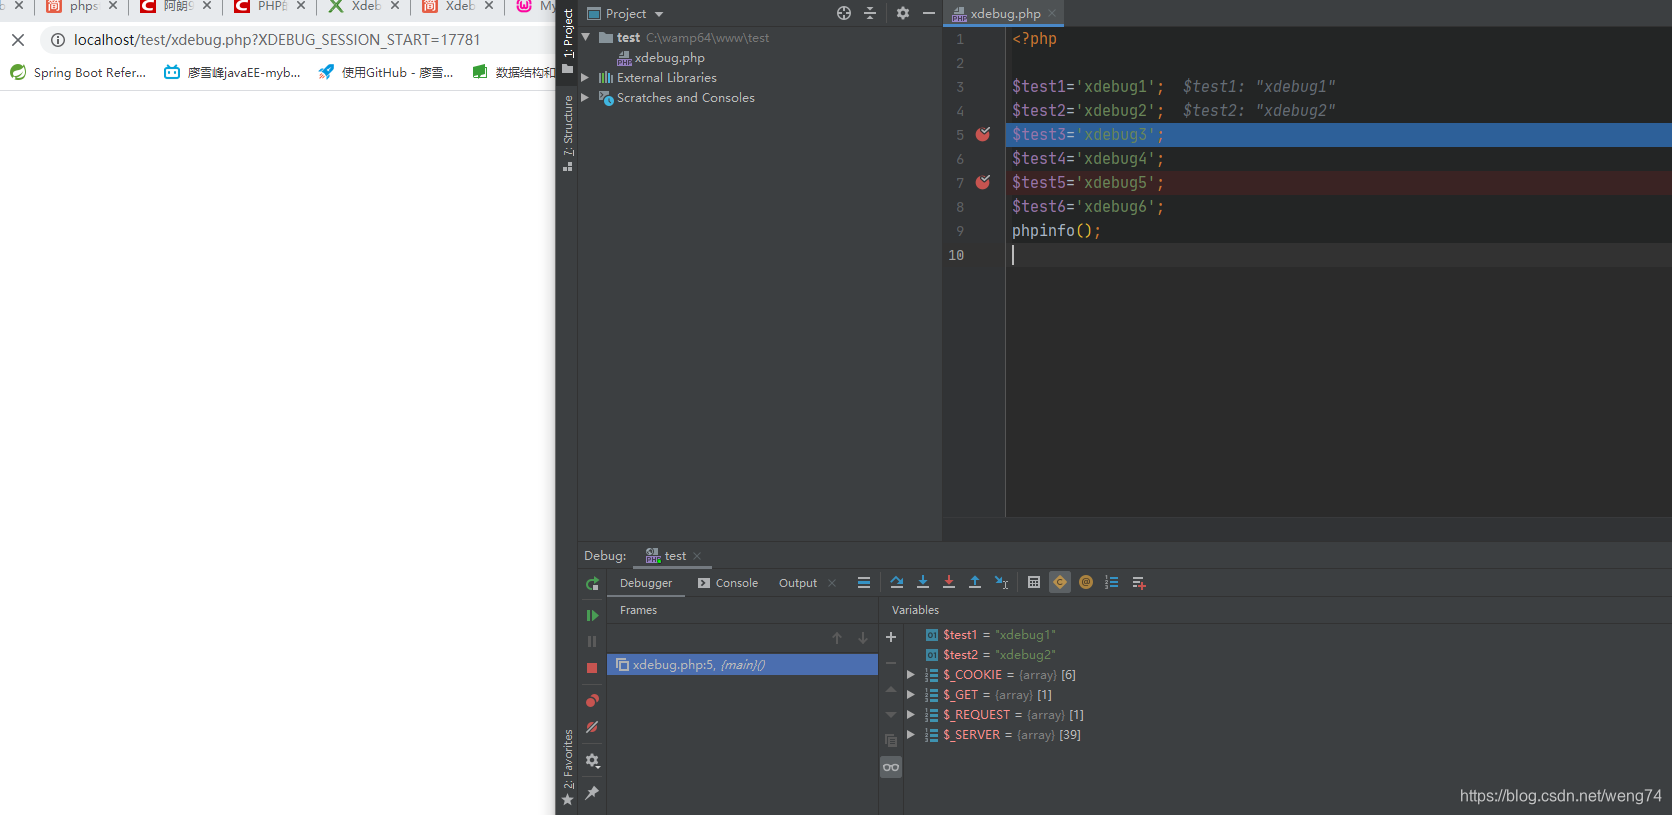
希望能帮助到大家调试BUg.-------------weng@