2、安装并配置 xdebug:
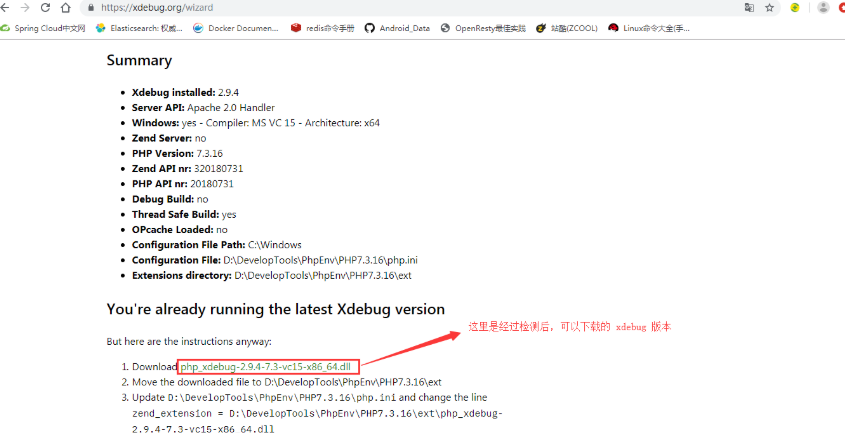
(1)将下载好的 .dll 文件放入指定位置(..\PHP7.3.16\ext)。
(2)配置 php.ini 文件,在文件末尾添加如下内容:
; 配置 xdebug
[xdebug]
zend_extension = "D:/DevelopTools/PhpEnv/PHP7.3.16/ext/php_xdebug-2.9.4-7.3-vc15-x86_64.dll"
; 开启远程调试
xdebug.remote_enable = On
;启用性能检测分析
xdebug.profiler_enable = On
;启用代码自动跟踪
xdebug.auto_trace = On
xdebug.profiler_enable_trigger = On
xdebug.profiler_output_name = cachegrind.out.%t.%p
;指定性能分析文件的存放目录
xdebug.profiler_output_dir = "D:/DevelopTools/PhpEnv/PHP7.3.16/tmp"
xdebug.show_local_vars = 0
;客户机 xdebug 监听端口和调试协议
xdebug.remote_handler = dbgp
xdebug.remote_port = 9000
; 客户机 ip
xdebug.remote_host = "localhost"
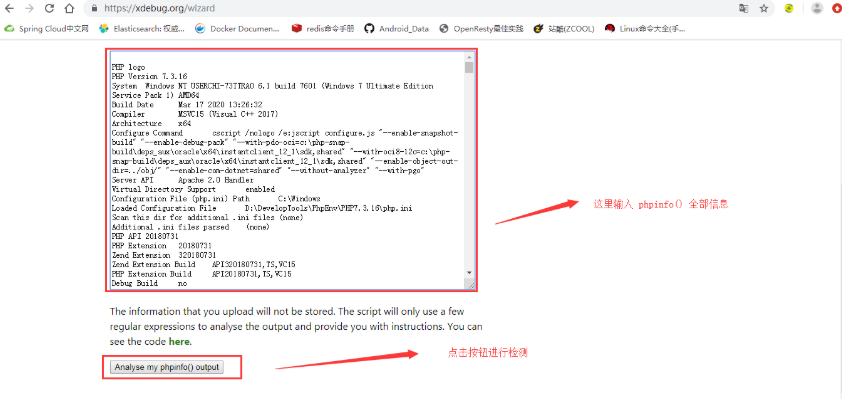
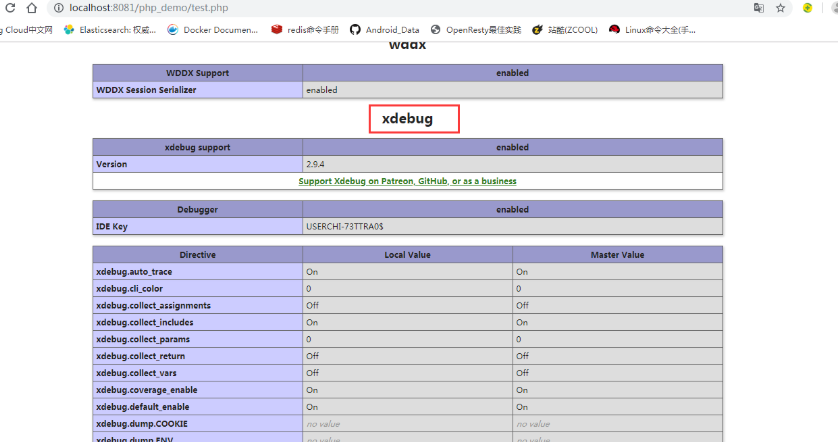
配置完成后,就可以重启你的环境了,然后在页面打印出 phpinfo() 信息就能看到有 xdebug 的信息了:
3、配置 phpstorm:
(1)FIle -> Settings -> PHP 中 Servers 的设置,如下图:
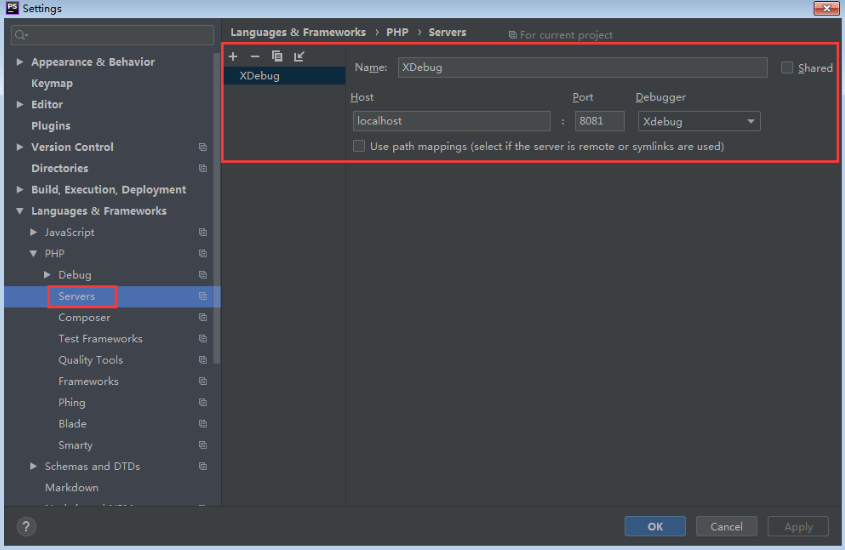
如上图,host 配置成刚才设置 php 配置文件中 xdebug.remote_host="localhost"对应的参数,端口使用 8081,debugger 选择 xdebug 即可。
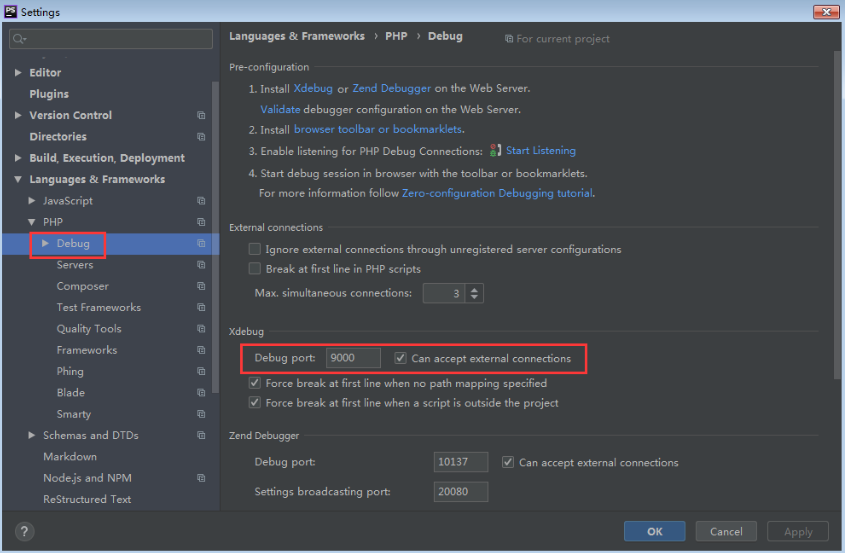
(2)Debug 的设置,如下图:
4、在 phpstorm中 使用 xdebug 进行调试:
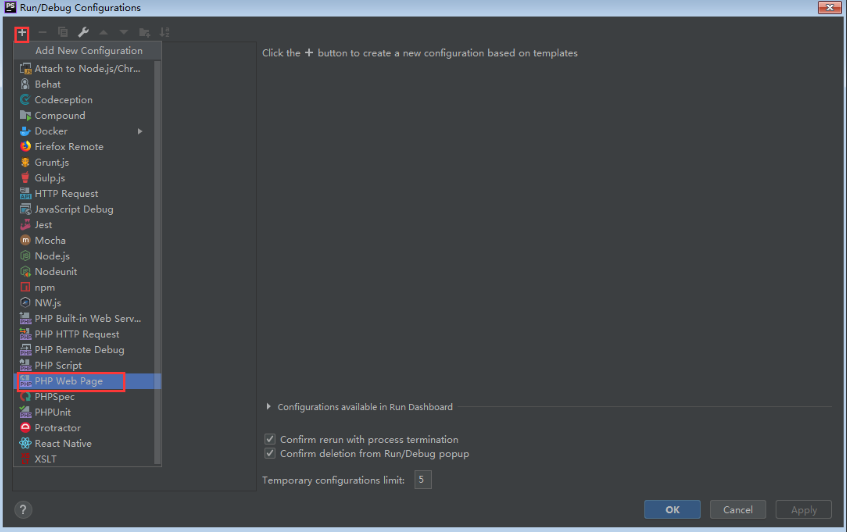
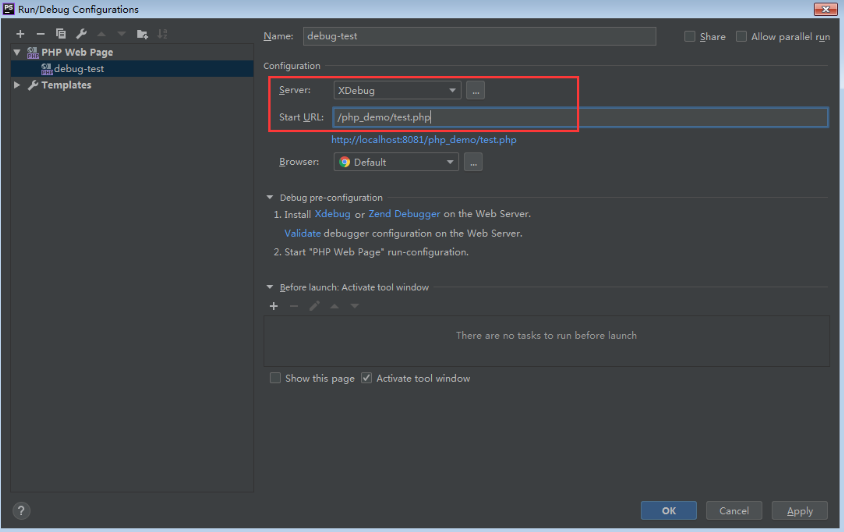
(1)添加运行/调试设置:
(2)进行调试:
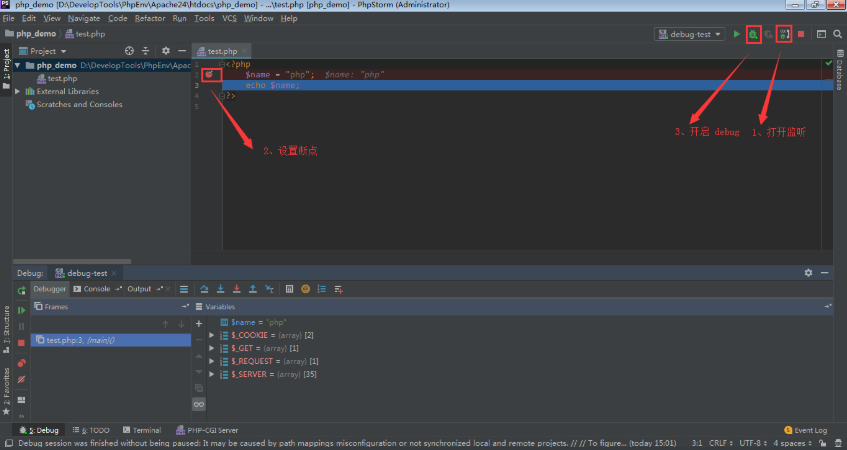
至此,在 phpstorm 中使用 xdebug 进行调试完成。
参考: