环境:window10 + phpstudy
第一步(大坑):将你正在使用的php加入环境变量。因为phpstudy默认是没有将php加入环境变量钟的,网上的各种文章也没有提及这一步骤,结果就是无论你怎么写配置都注定以失败告终,而且没有错误提示。本人在这踩了两小时的坑才发现。

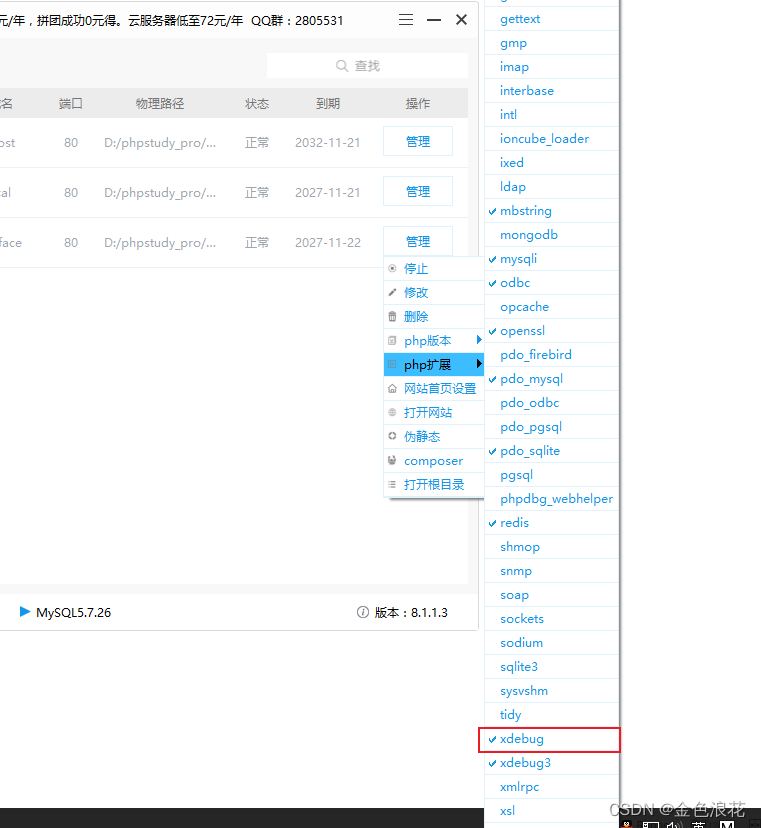
第二步:在phpstudy中启用xdebug扩展
第三步:打开php.ini,修改配置
[Xdebug]

zend_extension=D:/phpstudy_pro/Extensions/php/php7.3.4nts/ext/php_xdebug.dll
xdebug.collect_params=1
xdebug.collect_return=1
xdebug.auto_trace=On
xdebug.trace_output_dir=D:/phpstudy_pro/Extensions/php_log/php7.3.4nts.xdebug.trace
xdebug.profiler_enable=On
xdebug.profiler_output_dir=D:/phpstudy_pro/Extensions/php_log/php7.3.4nts.xdebug.profiler
xdebug.remote_enable=On
xdebug.remote_autostart = On
xdebug.remote_host=localhost
xdebug.remote_port=9001
xdebug.remote_handler=dbgp
端口最好不要用9000,不然会跟Nginx冲突
第三步,修改vscode配置
文件 > 首选项 > 设置

在打开的settings.json中,添加php路径
"php.debug.executablePath": "D:\\phpstudy_pro\\Extensions\\php\\php7.3.4nts\\php.exe",
"php.validate.executablePath": "D:\\phpstudy_pro\\Extensions\\php\\php7.3.4nts\\php.exe"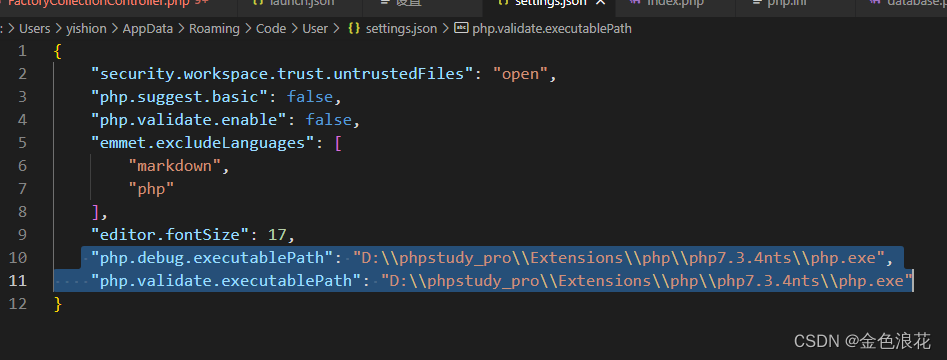
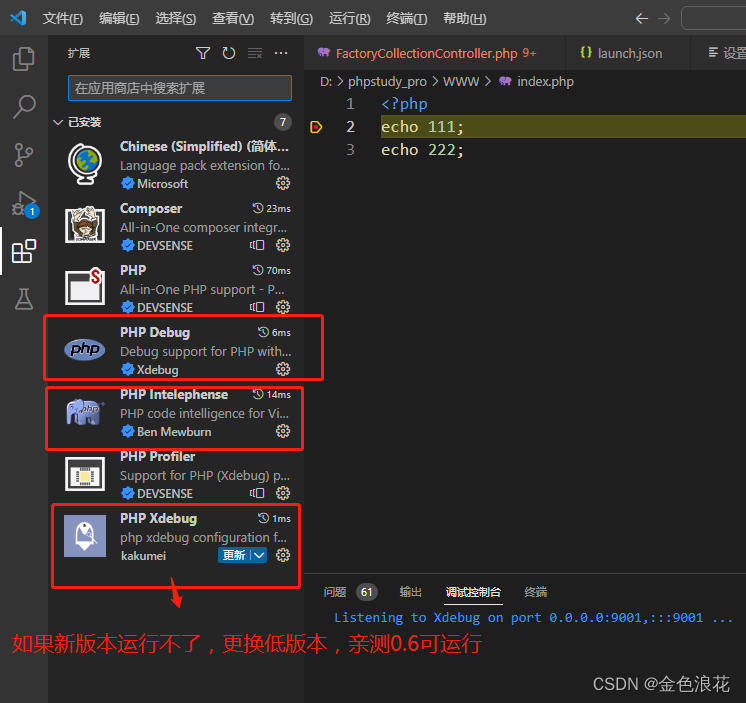
第四部,安装相关插件
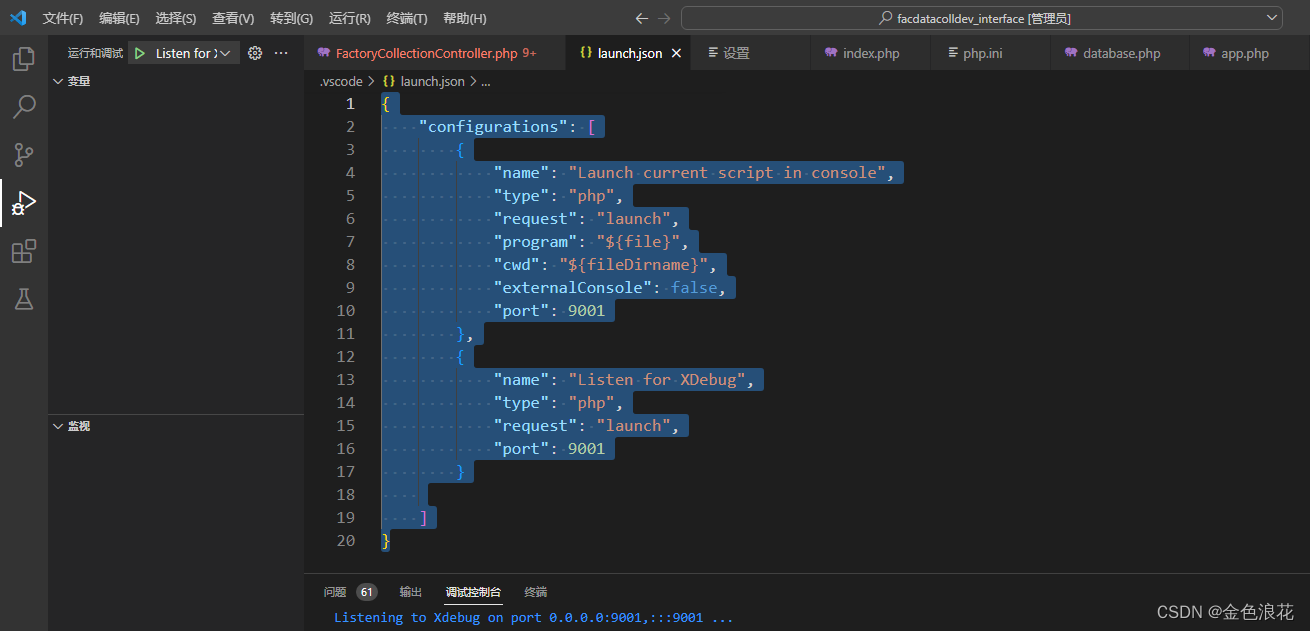
第五步,配置launch.json,注意端口号要跟php.ini中一致
{
    "configurations": [
        {
            "name": "Launch current script in console",
            "type": "php",
            "request": "launch",
            "program": "${file}",
            "cwd": "${fileDirname}",
            "externalConsole": false,
            "port": 9001
        },
        {
            "name": "Listen for XDebug",
            "type": "php",
            "request": "launch",
            "port": 9001
        }

    ]
}
然后开启调试,访问就可以了
