1、下载xdebug模块 (https://xdebug.org/)
注意:带"ts"是线程安全的意思,"nts"的他没有标示,也就是说,如果是nts的要下载没标示的,下载下来的文件名其实是有标示的。

使用xdebug官方提供的一个检测工具:https://xdebug.org/wizard.php
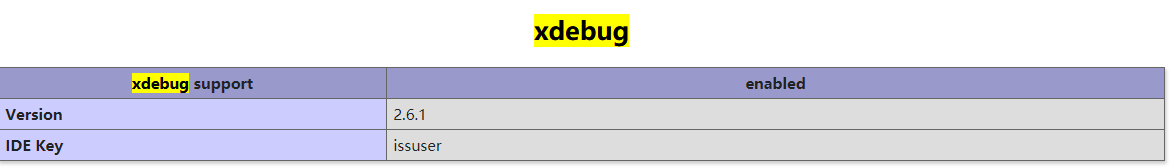
这里就把phpinfo()的信息使用输出出来(注意:使用输出函数,比如var_dump()),然后就会检测你的可以下载对应的版本,如下图:
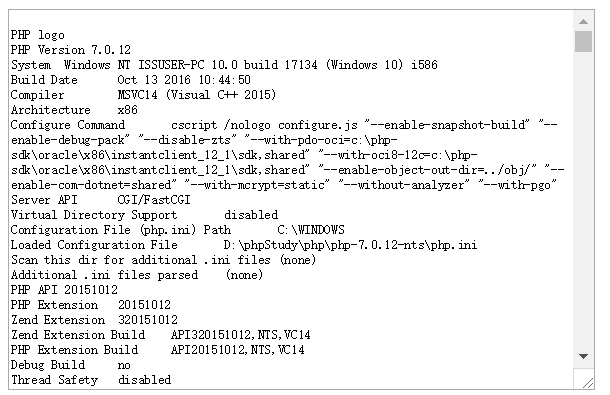

配置php.ini配置文件(这里需要注意一点,找对了php.ini文件),在网页上打印出phpinfo()的信息,查看这一条信息:
Loaded Configuration File D:\phpStudy\php\php-7.0.12-nts\php.ini
[xdebug]
zend_extension ="D:/phpStudy/php/php-7.0.12-nts/ext/php_xdebug-2.6.1-7.0-vc14-nts.dll"
xdebug.remote_enable = On
;启用性能检测分析
xdebug.profiler_enable = On
;启用代码自动跟踪
xdebug.auto_trace=On
xdebug.profiler_enable_trigger = On
xdebug.profiler_output_name = cachegrind.out.%t.%p
;指定性能分析文件的存放目录
xdebug.profiler_output_dir ="D:/phpStudy/tmp"
xdebug.show_local_vars=0
;配置端口和监听的域名
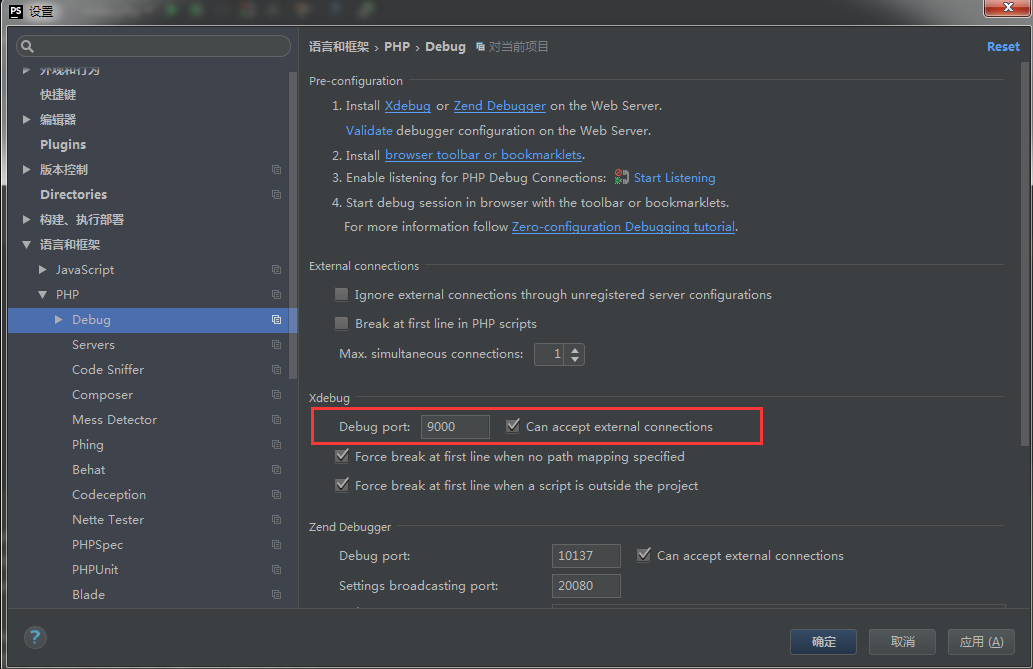
xdebug.remote_port=9000
xdebug.remote_host="localhost"