一、配置 Xdebug
配置 Xdebug 相关参数,在 php.ini 文件中新增如下配置,如果没安装的,请参考《PHP 安装 Xdebug扩展》:
[xdebug]
xdebug.remote_enable = on
xdebug.remote_handler = dbgp
xdebug.remote_mode = req
xdebug.remote_host = localhost
xdebug.remote_port = 9000
xdebug.idekey = PHPSTORM
重启 Apache,查看配置是否生效。
二、配置 PHPStorm
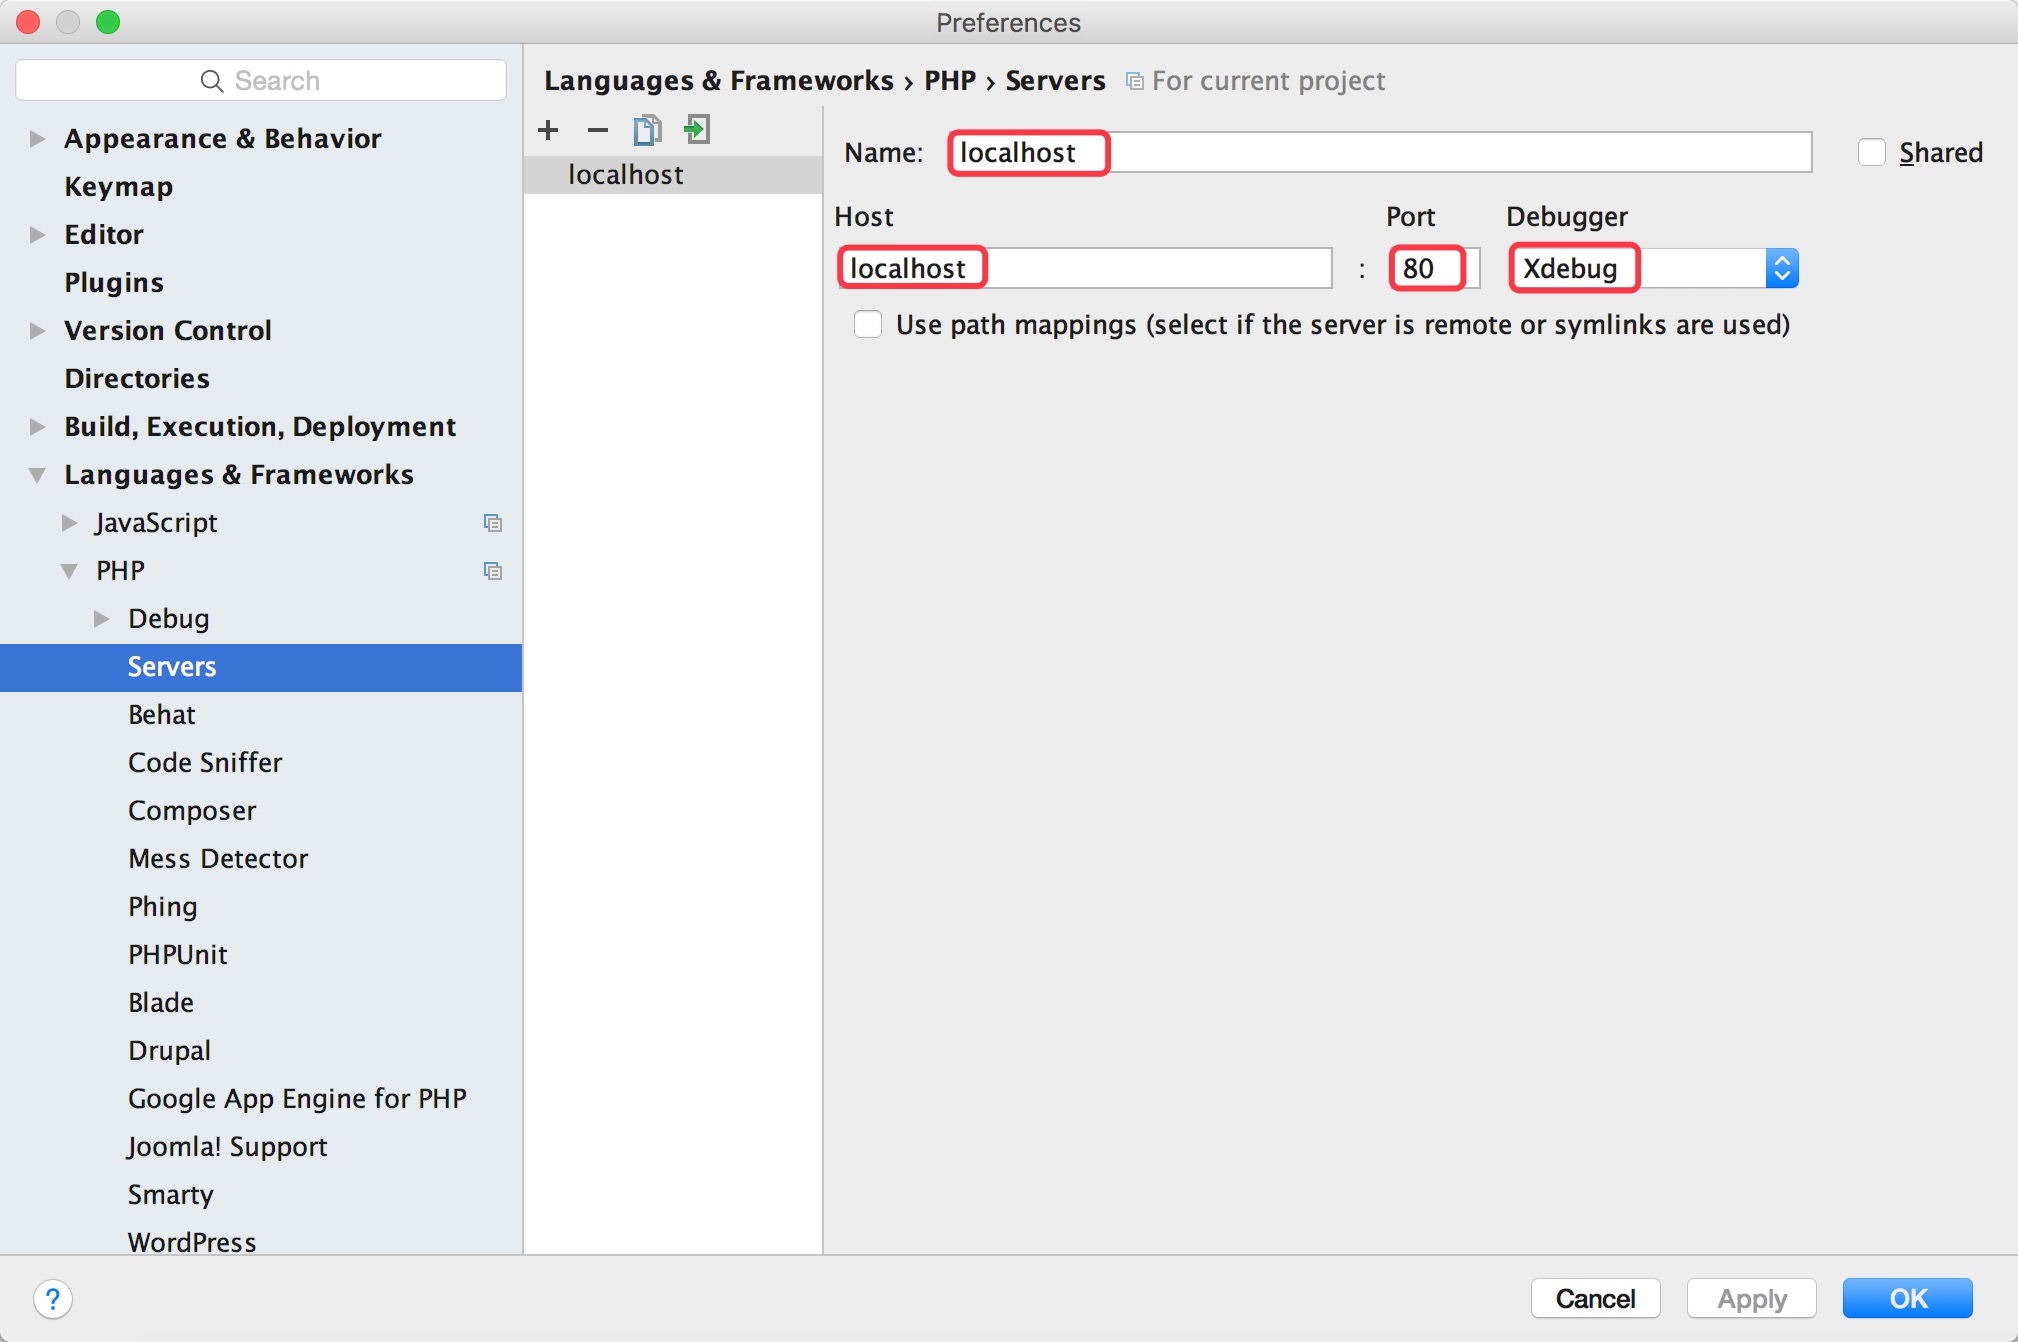
1. 配置 Servers,主要配置项如下图:
Mac 路径为:PHPStorm->Preferences->Languages & Frameworks->PHP->Servers
Win 路径为:File->Settings->Languages & Frameworks->PHP->Servers
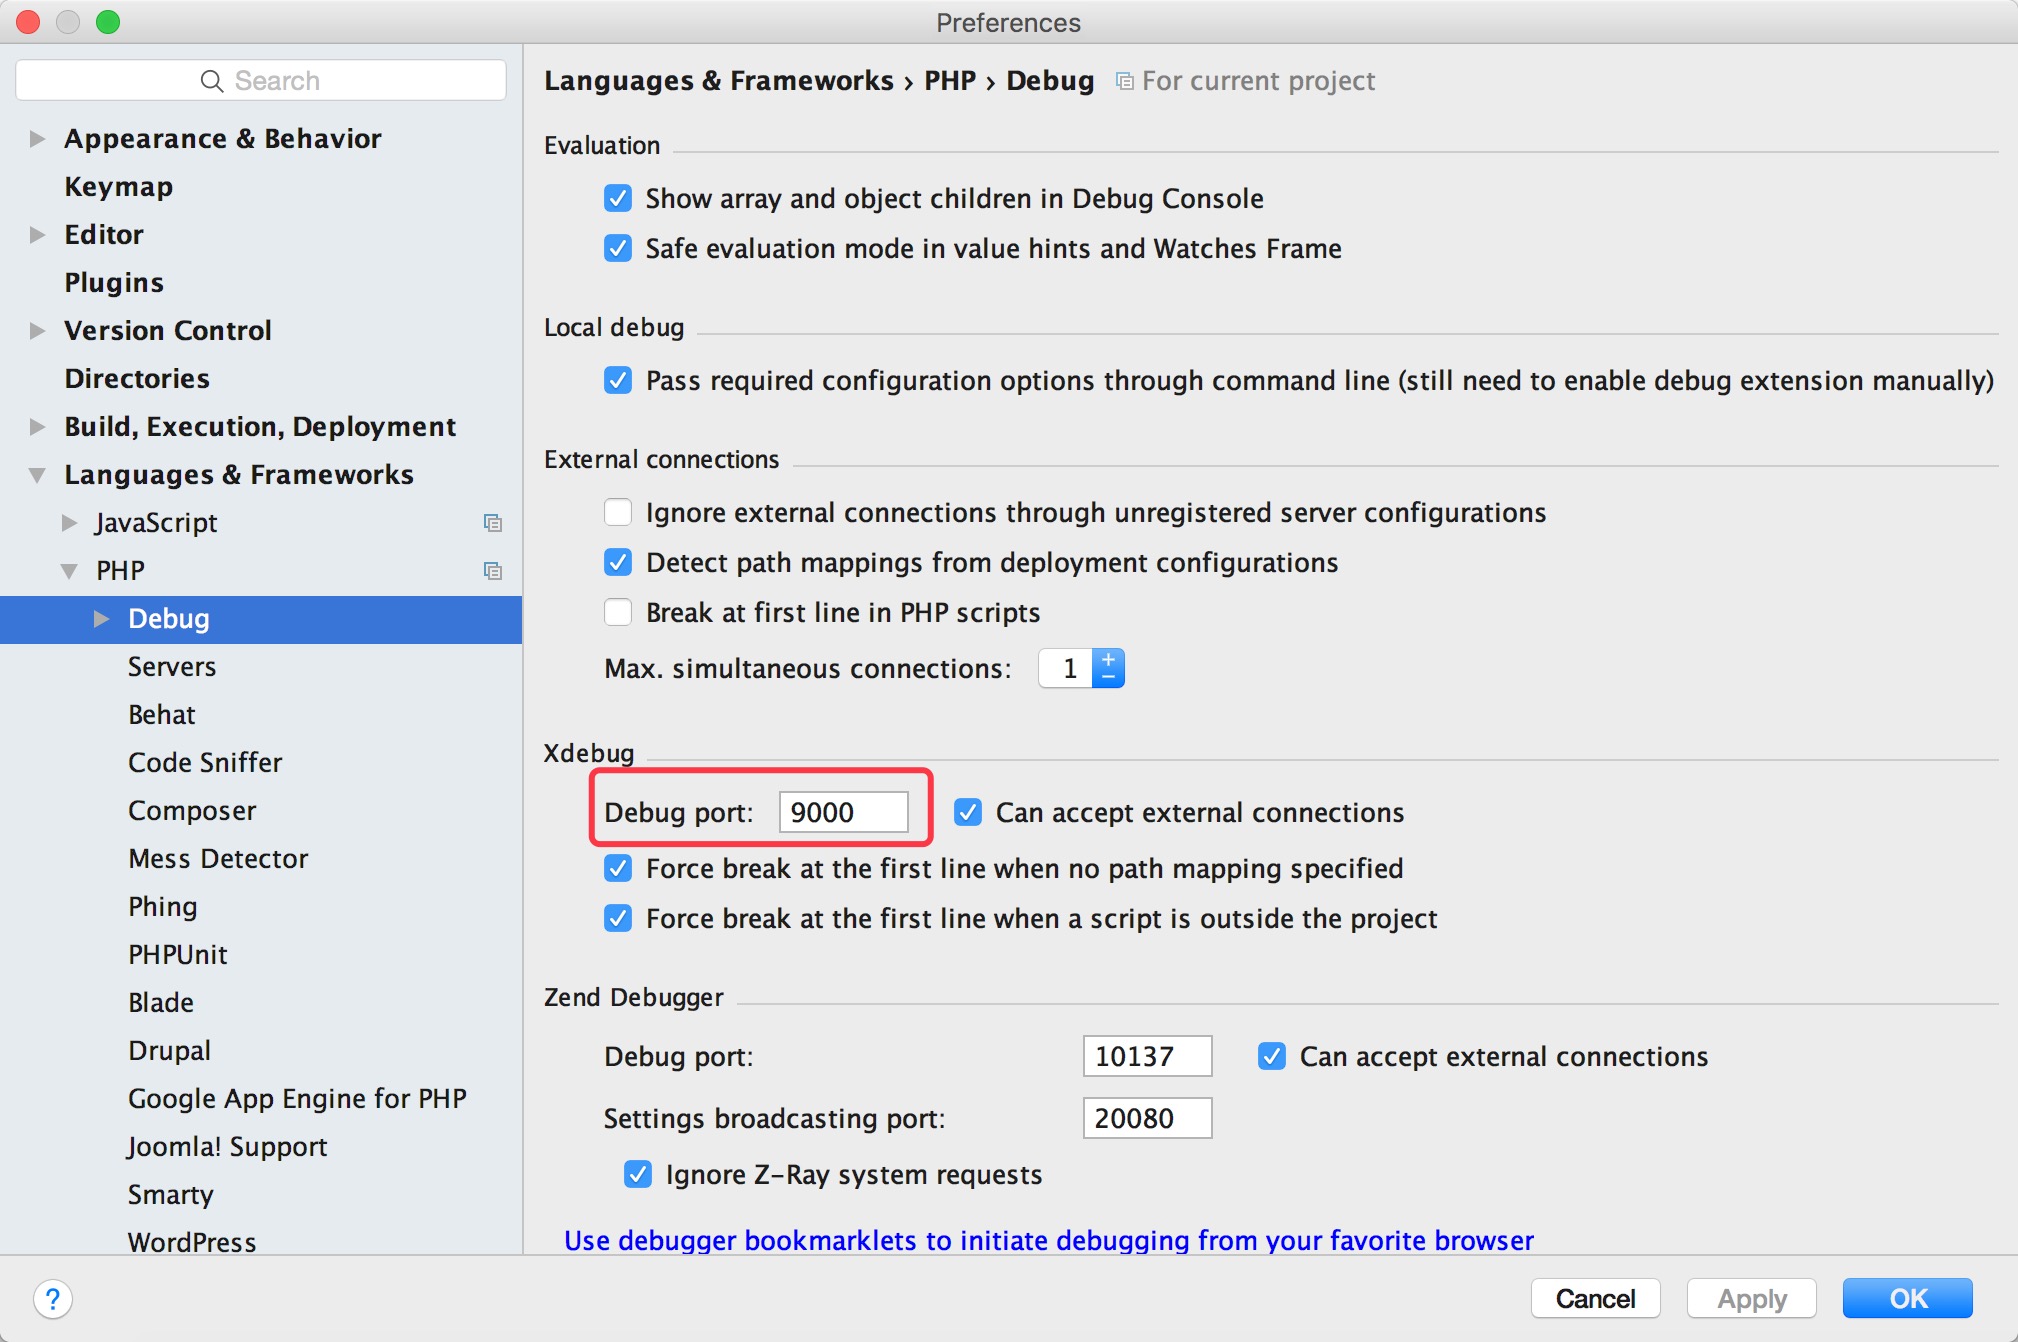
2. 配置 Debug,确保 Debug port 和上面的对应,其它选项默认即可:
Mac 路径为:PHPStorm->Preferences->Languages & Frameworks->PHP->Debug
Win 路径为:File->Settings->Languages & Frameworks->PHP->Debug
三、配置 XDebug helper
1. 在Chrome中搜索并安装 XDebug helper 扩展。
2. 安装成功后,在 Chrome 扩展程序列表中找到 XDebug helper,点击选项,将 IDE key 选项选为 PhpStorm。
四、使用 PHPStorm + Xdebug 实现断点调试
1. 在 PHPStorm 中开启 Debug 监听,点击右上角像电话一样的图标,图标变绿表示成功;
2. 在 Chrome 中开启 XDebug helper 插件: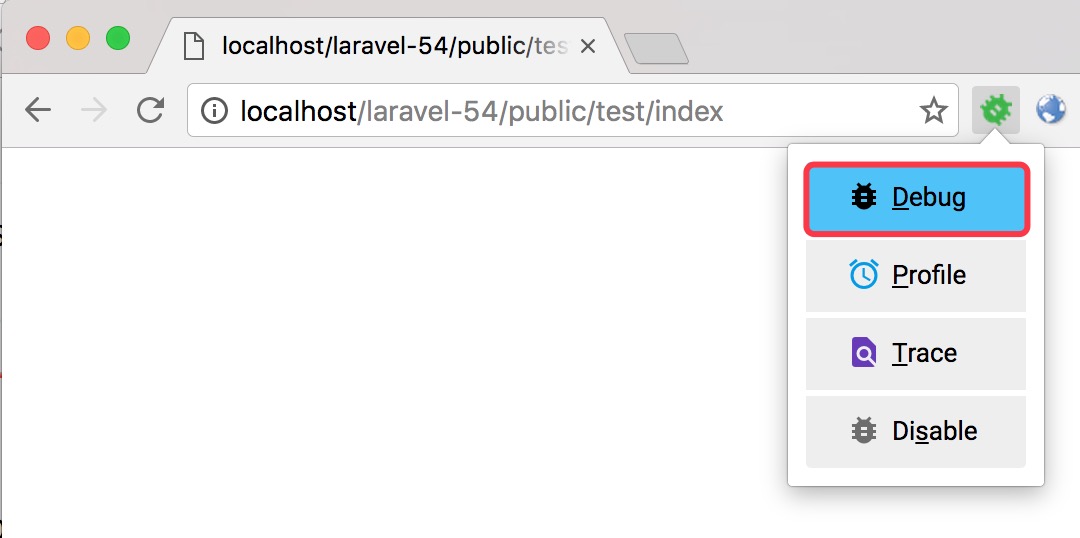
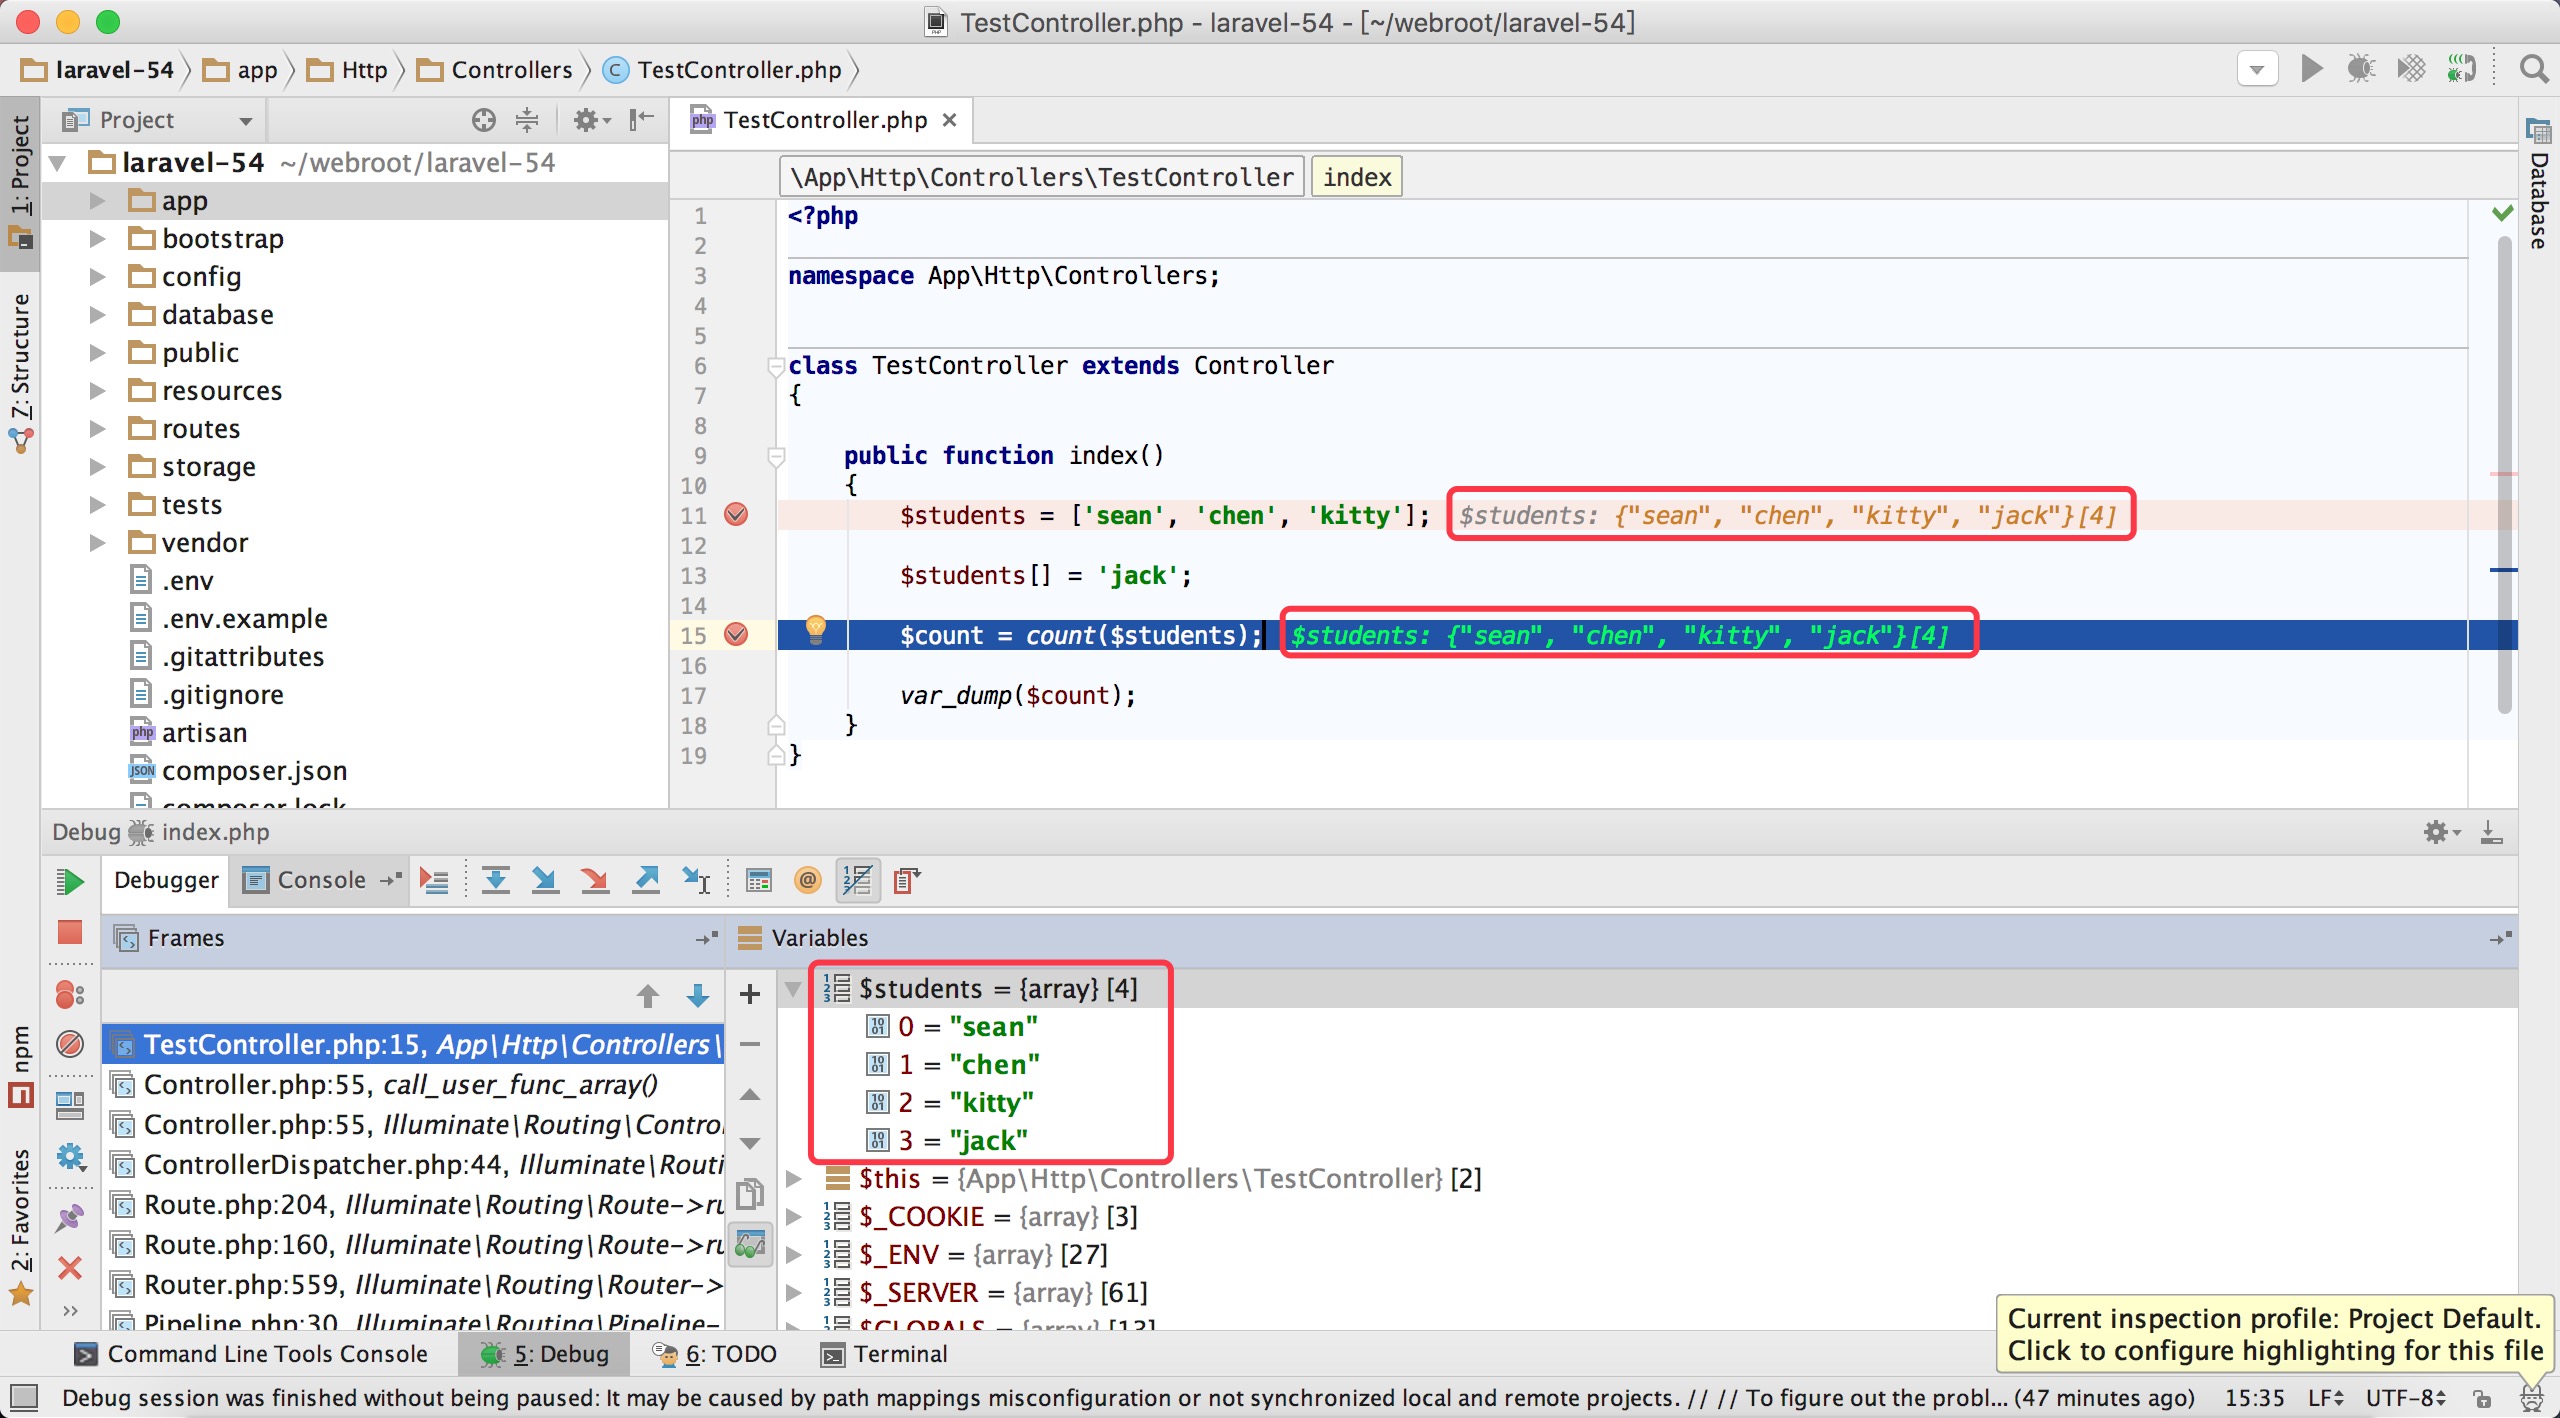
3. 在 PHPStorm 中设置断点,在需要断点调试的代码行前面单击即可;
4. 在浏览器中访问进行断点调试,成功后我们将可以看到如下调试信息: