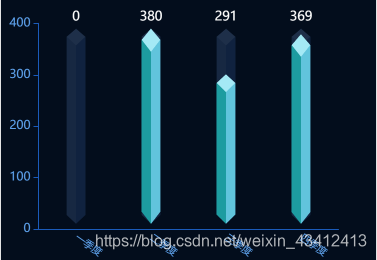
效果图:
<template>
  <div class="app_rank">
    <div id="echart_box"></div>
  </div>
</template>

<script>
export default {
  name: 'carRank',
  components: {
  },
  data () {
    return {
      img: require('../../assets/zhuzi.png'),
      img_0: require('../../assets/zhuzi_01.png')
    }
  },
  mounted () {
    this.initEchart();
  },
  methods: {
    initEchart () {
      const chartMonth = this.$echarts.init(document.getElementById('echart_box'));
      chartMonth.clear();
      chartMonth.showLoading();

      let option = {
        color: ['#bb0004', '#FFD48A'],
        tooltip: {
          trigger: 'axis',
          axisPointer: { // 坐标轴指示器,坐标轴触发有效
            type: 'shadow' // 默认为直线,可选为:'line' | 'shadow'
          },
          formatter: function (params) {
            return params[0].name + '<br/> ' + params[0].seriesName + params[0].value + '件';
          }
        },
        grid: {
          // containLabel: true,
          left: '10%',
          top: "9%",
          bottom: "12%",
        },
        xAxis: {
          data: [
            '一季度',
            '二季度',
            '三季度',
            '四季度'
          ],
          axisTick: {
            show: false
          },
          axisLabel: {
            color: '#5EA2ED',
            interval:0,
            rotate: -35,
            fontSize: 10
          },
          axisLine: {
            lineStyle: {
              color: '#1B5BBA',
            }
          }
        },
        yAxis: {
          splitLine: { show: false },
          axisLine: {
            lineStyle: {
              color: '#1B5BBA',
            }
          },
          axisLabel: {
            color: '#5EA2ED',
            interval: 0
          }
        },
        series: [
          {
            type: 'pictorialBar',
            name: '案件归类',
            barGap: '-100%',
            barWidth: '50%',
            zlevel: 10,
            symbolSize: ['50%', '100%'],
            symbolPosition: 'center',
            data: [
              {
                value: 0,
                // symbolPosition: 'center',
                // -5 为柱状图距离x轴的距离
                symbolOffset: [0, -5],
                // symbolRotate: -9,
                // symbolPosition: 'start',
                symbol: 'image://'+this.img,
              },
              {
                value: 380,
                // symbolPosition: 'center',
                symbolOffset: [0, -5],
                symbol: 'image://'+this.img,
              },
              {
                value: 291,
                // symbolPosition: 'center',
                symbolOffset: [0, -5],
                symbol: 'image://'+this.img,
              },
              {
                value: 369,
                symbolOffset: [0, -5],
                symbol: 'image://'+this.img,
              }
            ]
          },
          {
            type: 'pictorialBar',
            barWidth: '50%',
            name: '案件归类',
            symbolSize: ['50%', '100%'],
            symbolPosition: 'center',
            label: {
              normal: {
                show: true,
                position: "top",
                formatter: function (params) {
                  console.log('params', params)
                  return params.data.originValue;
                },
                color: "#fff",
                fontSize: 13
              }
            },
            data: [
              {
                value: 380,
                originValue: 0,
                // symbolPosition: 'center',
                symbolOffset: [0, -5],
                // symbolRotate: -9,
                // symbolPosition: 'start',
                symbol: 'image://'+this.img_0,
              },
              {
                value: 380,
                originValue: 380,
                // symbolPosition: 'center',
                symbolOffset: [0, -5],
                symbol: 'image://'+this.img_0,
              },
              {
                value: 380,
                originValue: 291,
                // symbolPosition: 'center',
                symbolOffset: [0, -5],
                symbol: 'image://'+this.img_0,
              },
              {
                value: 380,
                originValue: 369,
                symbolOffset: [0, -5],
                symbol: 'image://'+this.img_0,
              }
            ]
          }
        ]
      };
      chartMonth.setOption(option);
      chartMonth.hideLoading()
    }
  }
}
</script>
<style scoped>
  * {
    margin: 0;
    padding: 0;
  }
  #echart_box {
    width: 100%;
    height: 260px;
    margin-top: 20px;
    background-color: #030D1C;
  }
</style>
参考文章:https://blog.csdn.net/qq_40049863/article/details/94742126