机器学习-数据科学库:Pandas总结(2)
Pandas
Pandas数据合并之join
join:默认情况下他是把行索引相同的数据合并到一起。
In [81]: t1 = pd.DataFrame(np.ones(12).reshape((3,4)), index = list("ABC"))

In [82]: t1
Out[82]:
     0    1    2    3
A  1.0  1.0  1.0  1.0
B  1.0  1.0  1.0  1.0
C  1.0  1.0  1.0  1.0

In [83]: t2 = pd.DataFrame(np.zeros(10).reshape((2,5)), index=list("AB"), columns=list("VWXYZ"))

In [84]: t2
Out[84]:
     V    W    X    Y    Z
A  0.0  0.0  0.0  0.0  0.0
B  0.0  0.0  0.0  0.0  0.0

In [85]: t1.join(t2)
Out[85]:
     0    1    2    3    V    W    X    Y    Z
A  1.0  1.0  1.0  1.0  0.0  0.0  0.0  0.0  0.0
B  1.0  1.0  1.0  1.0  0.0  0.0  0.0  0.0  0.0
C  1.0  1.0  1.0  1.0  NaN  NaN  NaN  NaN  NaN

In [86]: t2.join(t1)
Out[86]:
     V    W    X    Y    Z    0    1    2    3
A  0.0  0.0  0.0  0.0  0.0  1.0  1.0  1.0  1.0
B  0.0  0.0  0.0  0.0  0.0  1.0  1.0  1.0  1.0
Pandas数据合并之merge
merge:按照指定的列把数据按照一定的方式合并到一起
- 默认的合并方式inner,交集
- merge outer,并集,NaN补全
- merge left,左边为准,NaN补全
- merge right,右边为准,NaN补全
In [108]: t1
Out[108]:
     M    N  O    P
A  1.0  1.0  a  1.0
B  1.0  1.0  b  1.0
C  1.0  1.0  c  1.0

In [109]: t2
Out[109]:
     V    W  X    Y    Z
A  0.0  0.0  a  0.0  0.0
B  0.0  0.0  b  0.0  0.0

In [110]: t1.merge(t2, left_on="O", right_on="X")
Out[110]:
     M    N  O    P    V    W  X    Y    Z
0  1.0  1.0  a  1.0  0.0  0.0  a  0.0  0.0
1  1.0  1.0  b  1.0  0.0  0.0  b  0.0  0.0

In [111]: t1.merge(t2, left_on="O", right_on="X", how="inner")
Out[111]:
     M    N  O    P    V    W  X    Y    Z
0  1.0  1.0  a  1.0  0.0  0.0  a  0.0  0.0
1  1.0  1.0  b  1.0  0.0  0.0  b  0.0  0.0

In [112]: t1.merge(t2, left_on="O", right_on="X", how="outer")
Out[112]:
     M    N  O    P    V    W    X    Y    Z
0  1.0  1.0  a  1.0  0.0  0.0    a  0.0  0.0
1  1.0  1.0  b  1.0  0.0  0.0    b  0.0  0.0
2  1.0  1.0  c  1.0  NaN  NaN  NaN  NaN  NaN

In [113]: t1.merge(t2, left_on="O", right_on="X", how="left")
Out[113]:
     M    N  O    P    V    W    X    Y    Z
0  1.0  1.0  a  1.0  0.0  0.0    a  0.0  0.0
1  1.0  1.0  b  1.0  0.0  0.0    b  0.0  0.0
2  1.0  1.0  c  1.0  NaN  NaN  NaN  NaN  NaN

In [114]: t1.merge(t2, left_on="O", right_on="X", how="right")
Out[114]:
     M    N  O    P    V    W  X    Y    Z
0  1.0  1.0  a  1.0  0.0  0.0  a  0.0  0.0
Pandas分组和聚合
在pandas中类似的分组的操作我们有很简单的方式来完成。
那么问题来了,调用groupby方法之后返回的是什么内容?
grouped=df.groupby(by=“columns_name”)
grouped是一个DataFrameGroupBy对象,是可迭代的
grouped中的每一个元素是一个元组
元组里面是(索引(分组的值),分组之后的DataFrame)
DataFrameGroupBy对象有很多经过优化的方法:

索引和复合索引
简单的索引操作:
- 获取index:df.index
- 指定index:df.index=[‘x’,‘y’]
- 重新设置index: df.reindex(list(“abcedf”))
- 指定某一列作为index:df.set_index(“Country”,drop=False)
- 返回index的唯一值:df.set_index(“Country”).index.unique()
假设a为一个DataFrame,那么当a.set_index([“c”,“d”])即设置两个索引的时候是什么样子的结果呢?
In [115]: a = pd.DataFrame({

    'a': range(7),'b': range(7, 0, -1),'c': ['one','one','one','two','two','two',
     ...: 'two'],'d': list("hjklmno")})

In [116]: a
Out[116]:
   a  b    c  d
0  0  7  one  h
1  1  6  one  j
2  2  5  one  k
3  3  4  two  l
4  4  3  two  m
5  5  2  two  n
6  6  1  two  o

In [117]: a.set_index(["c", "d"])
Out[117]:
       a  b
c   d
one h  0  7
    j  1  6
    k  2  5
two l  3  4
    m  4  3
    n  5  2
    o  6  1
In [122]: x = a.set_index(["c", "d"])["a"]

In [123]: x
Out[123]:
c    d
one  h    0
     j    1
     k    2
two  l    3
     m    4
     n    5
     o    6
Name: a, dtype: int64

In [124]: x[("one","h")]
Out[124]: 0
level相当于就是复合索引的里外层,交换了level之后,里外交换所以能够直接从h开始取值。
In [131]: x.index
Out[131]:
MultiIndex([('one', 'h'),
            ('one', 'j'),
            ('one', 'k'),
            ('two', 'l'),
            ('two', 'm'),
            ('two', 'n'),
            ('two', 'o')],
           names=['c', 'd'])

In [132]: x.index.levels
Out[132]: FrozenList([['one', 'two'], ['h', 'j', 'k', 'l', 'm', 'n', 'o']])

In [133]: x.swaplevel()
Out[133]:
d  c
h  one    0
j  one    1
k  one    2
l  two    3
m  two    4
n  two    5
o  two    6
Name: a, dtype: int64


In [135]: x.swaplevel()["h","one"]
Out[135]: 0
pandas时间序列
不管在什么行业,时间序列都是一种非常重要的数据形式,很多统计数据以及数据的规律也都和时间序列有着非常重要的联系,在pandas中处理时间序列是非常简单的。
生成一段时间范围
pd.date_range(start=None, end=None, periods=None, freq='D')
start和end以及freq配合能够生成start和end范围内以频率freq的一组时间索引start和periods以及freq配合能够生成从start开始的频率为freq的periods个时间索引。
In [140]: pd.date_range(start="20201231",periods=10,freq="M")
Out[140]:
DatetimeIndex(['2020-12-31', '2021-01-31', '2021-02-28', '2021-03-31',
               '2021-04-30', '2021-05-31', '2021-06-30', '2021-07-31',
               '2021-08-31', '2021-09-30'],
              dtype='datetime64[ns]', freq='M')


In [142]: pd.date_range(start="20201231",periods=10,freq="10D")
Out[142]:
DatetimeIndex(['2020-12-31', '2021-01-10', '2021-01-20', '2021-01-30',
               '2021-02-09', '2021-02-19', '2021-03-01', '2021-03-11',
               '2021-03-21', '2021-03-31'],
              dtype='datetime64[ns]', freq='10D')
In [143]: pd.date_range(start="20201231",end="20211231",freq="10D")
Out[143]:
DatetimeIndex(['2020-12-31', '2021-01-10', '2021-01-20', '2021-01-30',
               '2021-02-09', '2021-02-19', '2021-03-01', '2021-03-11',
               '2021-03-21', '2021-03-31', '2021-04-10', '2021-04-20',
               '2021-04-30', '2021-05-10', '2021-05-20', '2021-05-30',
               '2021-06-09', '2021-06-19', '2021-06-29', '2021-07-09',
               '2021-07-19', '2021-07-29', '2021-08-08', '2021-08-18',
               '2021-08-28', '2021-09-07', '2021-09-17', '2021-09-27',
               '2021-10-07', '2021-10-17', '2021-10-27', '2021-11-06',
               '2021-11-16', '2021-11-26', '2021-12-06', '2021-12-16',
               '2021-12-26'],
              dtype='datetime64[ns]', freq='10D')
关于频率的更多缩写

Pandas重采样
重采样:指的是将时间序列从一个频率转化为另一个频率进行处理的过程,将高频率数据转化为低频率数据为降采样,低频率转化为高频率为升采样。
resample
pandas提供了一个resample的方法来帮助我们实现频率转化。
In [144]: t = pd.DataFrame(np.random.uniform(10,50,(100,1)), index=pd.date_range("20200130",periods=100))

In [145]: t
Out[145]:
                    0
2020-01-30  24.407854
2020-01-31  46.911303
2020-02-01  34.542611
2020-02-02  38.508152
2020-02-03  22.849967
...               ...
2020-05-04  27.052826
2020-05-05  29.397945
2020-05-06  33.431079
2020-05-07  24.048044
2020-05-08  17.178897

[100 rows x 1 columns]

In [146]: t.resample("M").mean()
Out[146]:
                    0
2020-01-31  35.659578
2020-02-29  32.899584
2020-03-31  27.158682
2020-04-30  27.732471
2020-05-31  29.030154

In [147]: t.resample("10D").count()
Out[147]:
             0
2020-01-30  10
2020-02-09  10
2020-02-19  10
2020-02-29  10
2020-03-10  10
2020-03-20  10
2020-03-30  10
2020-04-09  10
2020-04-19  10
2020-04-29  10
PeriodIndex
之前所学习的DatetimeIndex可以理解为时间戳
那么现在我们要学习的PeriodIndex可以理解为时间段
periods = pd.PeriodIndex(year=data["year"],month=data["month"],day=data["day"],hour=data["hour"],freq="H")
那么如果给这个时间段降采样呢?
data =df.set_index(periods).resample("10D").mean()
Pandas数据分析练习
练习一
现在我们有一组关于全球星巴克店铺的统计数据,如果我想知道美国的星巴克数量和中国的哪个多,那么应该怎么办?
数据来源:https://www.kaggle.com/starbucks/store-locations/data
import pandas as pd
import numpy as np
import matplotlib.pyplot as plt

df = pd.read_csv('./starbucks_store_worldwide.csv')
print(df.info())
print(df.groupby("Country").count()["Brand"])

_x = df.groupby("Country").count()["Brand"].sort_values(ascending=False).index[:10]
_y = df.groupby("Country").count()["Brand"].sort_values(ascending=False).values[:10]


#设置字体和负号的代码
plt.rcParams['font.sans-serif']=['Microsoft YaHei']
plt.rcParams['axes.unicode_minus'] = False

#绘图风格
plt.style.use('ggplot')

#图片大小
plt.figure(figsize=(20,12), dpi = 80)

#横坐标标签
x = range(len(_x))
plt.yticks(x, _x)


#绘图
plt.barh(x,_y)


plt.show()

练习二
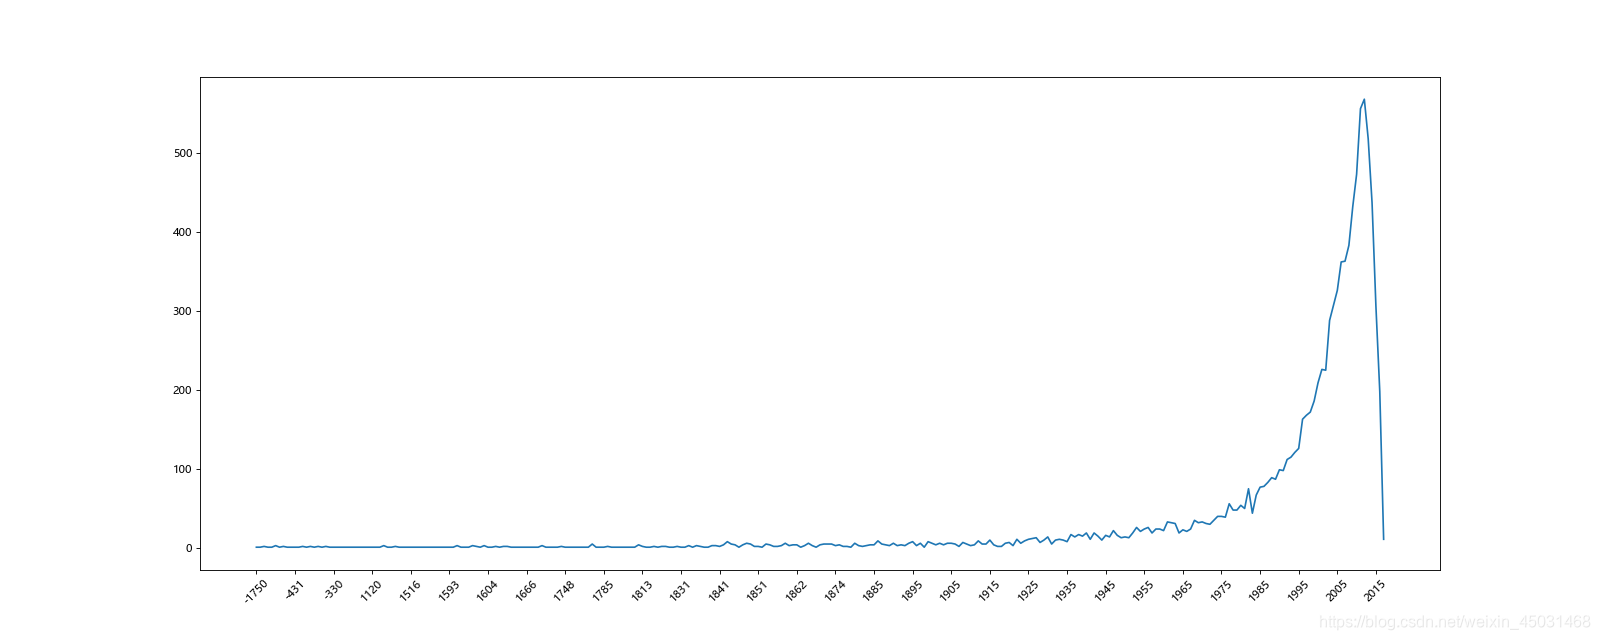
现在我们有全球排名靠前的10000本书的数据,那么请统计一下不同年份书的数量。
收据来源:https://www.kaggle.com/zygmunt/goodbooks-10k
import pandas as pd
import numpy as np
import matplotlib.pyplot as plt

df = pd.read_csv("./books.csv")

print(df.info())

_x = df.groupby("original_publication_year").count()["id"].index
_y = df.groupby("original_publication_year").count()["id"].values


x = range(len(_x))
#画图
plt.figure(figsize=(20,8),dpi=80)

plt.xticks(x[::10],_x[::10].astype(int),rotation=45)

#设置字体和负号的代码
plt.rcParams['font.sans-serif']=['Microsoft YaHei']
plt.rcParams['axes.unicode_minus'] = False

#绘图风格
plt.style.use('ggplot')

plt.plot(range(len(_x)), _y)

plt.show()
练习三
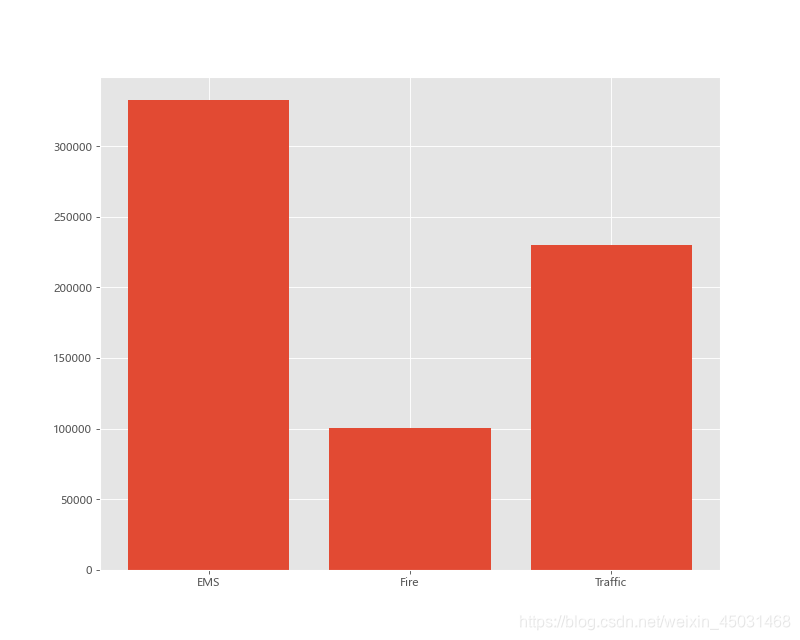
现在我们有2015到2017年25万条911的紧急电话的数据,请统计出出这些数据中不同类型的紧急情况的次数,如果我们还想统计出不同月份不同类型紧急电话的次数的变化情况,应该怎么做呢?
数据来源:https://www.kaggle.com/mchirico/montcoalert/data
不同类型的紧急情况的次数:
import pandas as pd
import numpy as np
import matplotlib.pyplot as plt
pd.set_option('display.max_columns', None)

df = pd.read_csv("./911.csv")

# print(df.info())
# print(df.head())

title_list = df["title"].str.split(": ").tolist()
cate_list = [i[0] for i in title_list]
# print(cate_list)
df["cate"] = pd.Series(cate_list)
# print(df["cate"].head())

_x = df.groupby("cate").count()["title"].index
_y = df.groupby("cate").count()["title"].values


#设置字体和负号的代码
plt.rcParams['font.sans-serif']=['Microsoft YaHei']
plt.rcParams['axes.unicode_minus'] = False

#绘图风格
plt.style.use('ggplot')

#图片大小
plt.figure(figsize=(10,8), dpi = 80)

#横坐标标签
x = range(len(_x))
plt.xticks(x, _x)


#绘图
plt.bar(x,_y)


plt.show()
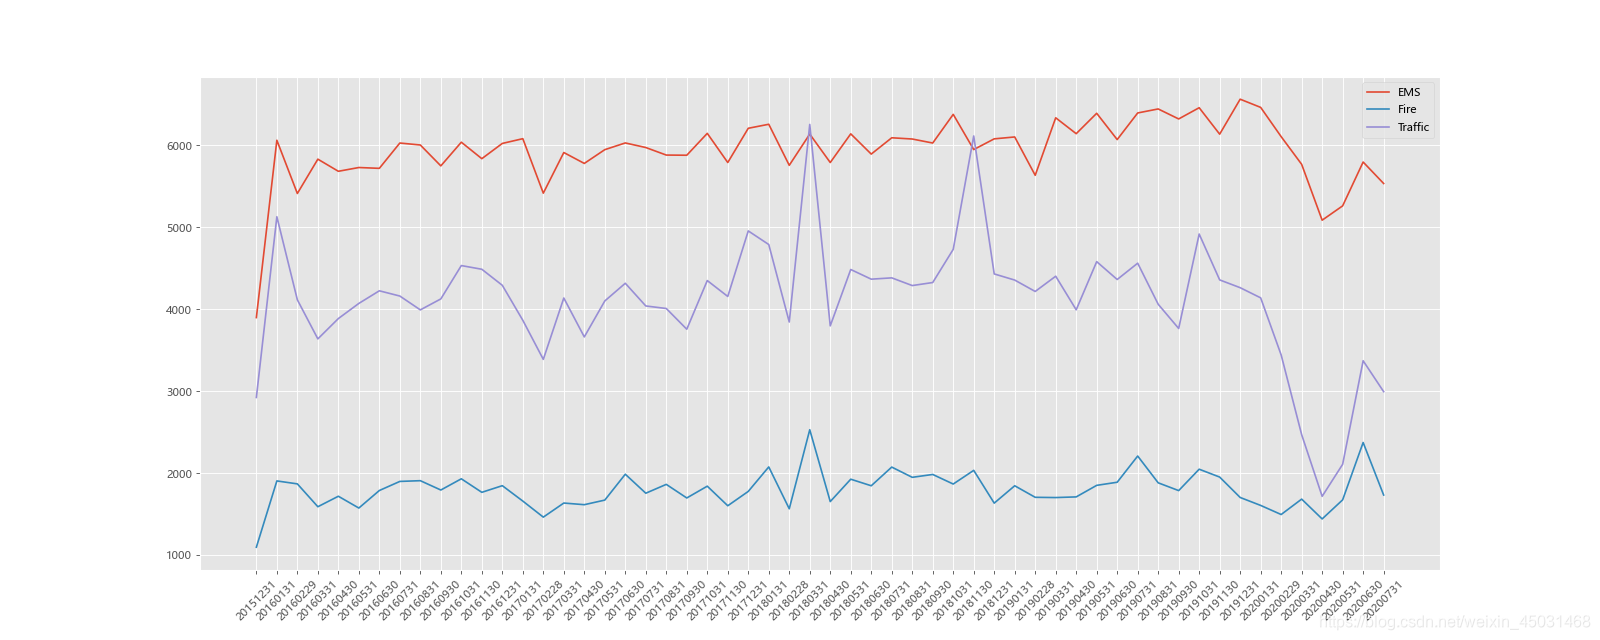
不同月份不同类型紧急电话的次数:
import pandas as pd
import numpy as np
import matplotlib.pyplot as plt
pd.set_option('display.max_columns', None)

df = pd.read_csv("./911.csv")

print(df.info())
# print(df.head())

title_list = df["title"].str.split(": ").tolist()
cate_list = [i[0] for i in title_list]
# print(cate_list)
df["cate"] = pd.Series(cate_list)
# print(df["cate"].head())
df["timeStamp"] = pd.to_datetime(df["timeStamp"])

df.set_index("timeStamp", inplace=True)

#设置字体和负号的代码
plt.rcParams['font.sans-serif']=['Microsoft YaHei']
plt.rcParams['axes.unicode_minus'] = False

#绘图风格
plt.style.use('ggplot')

#图片大小
plt.figure(figsize=(20,8), dpi = 80)

for group_name, group_data in df.groupby("cate"):
    month_resample = group_data.resample("M").count()["title"]

    _x = month_resample.index
    _y = month_resample.values

    _x = [i.strftime("%Y%m%d") for i in _x]

    plt.plot(range(len(_x)), _y, label=group_name)
    # 横坐标标签

    plt.xticks(range(len(_x)), _x, rotation=45)


plt.legend(loc = "best")

plt.show()