import csv
from datetime import datetime
from matplotlib import pyplot as plt

filename = 'E:\PYTHON\《Python编程》源代码文件\chapter_16\sitka_weather_07-2014.csv'
from matplotlib import pyplot as plt

with open(filename) as f:
    # 创建与该文件相关联的阅读器
    # 下面的就是迭代器,要通过next调用
    # reader = csv.reader(f)
    # header_row = next(reader)
    # #相当于将整个数据的行作为一个数值,如果用next就可以不断调用。
    # #for index,column_header in enumerate(header_row):
    #
    # #利用enumerate,我们定义了index,将每个指标的列进行的位置定位。
    # highs = []
    # for row in reader:
    #     highs.append((row[1]))
    # #这里打印出来的highs就是最高气温的温度,就是统计了所有样本的最高温度。
    class temperature():
        def __init__(self):
            self.reader = csv.reader(f)
            self.header_row = next(self.reader)
            self.highs = []
            self.alldate = []
            #self.header_row表示为列

        def all_row(self):
            for row in self.reader:
                current_date = datetime.strptime(row[0],"%Y-%m-%d")
                self.alldate.append(current_date)
                high = int(row[1])
                self.highs.append(high)

    high = temperature()
    high.all_row()
    highs_temp = high.highs
    current_date = high.alldate

    fig = plt.figure(dpi=128, figsize=(10, 6))
    plt.plot(current_date,highs_temp, c='red')
    #current_date作用于X坐标,highs_temp作用于y坐标
    plt.title('Daily high temperatures, july 2014', fontsize=24)
    plt.xlabel('', fontsize=16)
    plt.ylabel('temperature (F)', fontsize=16)
    plt.tick_params(axis='both',which = 'major ',labelsize = 16)
    plt.show()
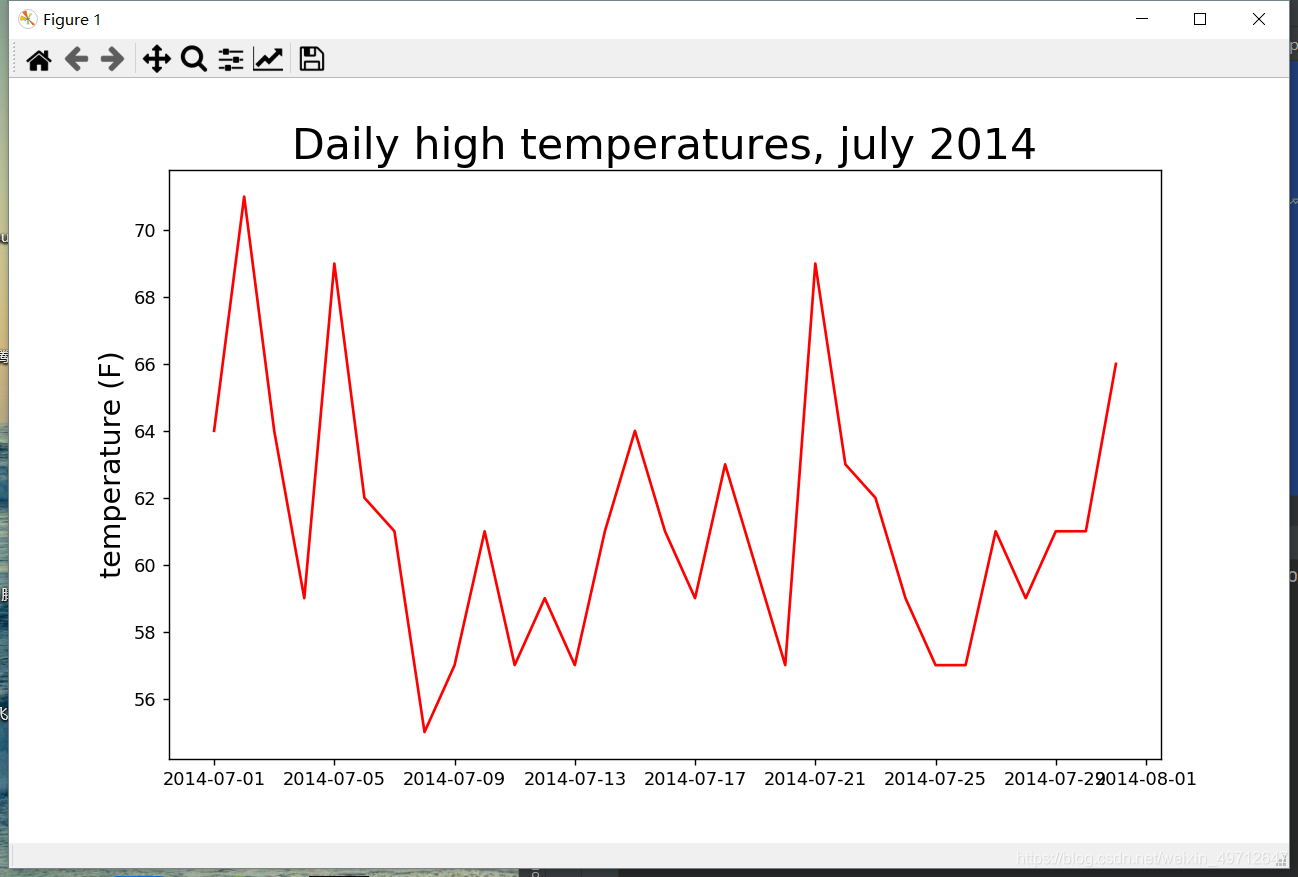
根据书上内容,我将原有的数据进行类化,将温度和日期分别添加到列表中。(self.high,self.alldate),但是必须要先调用all_row函数,这样才会将数据添加到列表中。
这里还可以在生成折线图后,添加一个防止标签重合的代码:
    fig.autofmt_xdate()
    ```
import csv
from datetime import datetime
from matplotlib import pyplot as plt
filename = ‘E:\PYTHON\《Python编程》源代码文件\chapter_16\death_valley_2014.csv’
from matplotlib import pyplot as plt
with open(filename) as f:
# 创建与该文件相关联的阅读器
# 下面的就是迭代器,要通过next调用
# reader = csv.reader(f)
# header_row = next(reader)
# #相当于将整个数据的行作为一个数值,如果用next就可以不断调用。
# #for index,column_header in enumerate(header_row):
#
# #利用enumerate,我们定义了index,将每个指标的列进行的位置定位。
# highs = []
# for row in reader:
# highs.append((row[1]))
# #这里打印出来的highs就是最高气温的温度,就是统计了所有样本的最高温度。
class temperature():
def init(self):
self.reader = csv.reader(f)
self.header_row = next(self.reader)
self.highs = []
self.alldate = []
self.lows = []
#self.header_row表示为列
    def all_row(self):
        for row in self.reader:
            try:
                current_date = datetime.strptime(row[0],"%Y-%m-%d")
                high = int(row[1])
                low = int(row[3])

            except ValueError:
                print(current_date,'missing date')
            else:
                self.lows.append(low)
                self.highs.append(high)
                self.alldate.append(current_date)

high = temperature()
high.all_row()
highs_temp = high.highs
current_date = high.alldate
lows_temp = high.lows
fig = plt.figure(dpi=128, figsize=(10, 6))
plt.plot(current_date,highs_temp, c='red',alpha = 0.5)
plt.plot(current_date,lows_temp, c = 'blue',alpha = 0.5)
#通过faceclor填充了区域的颜色,alpha表示透明度。
plt.fill_between(current_date,highs_temp,lows_temp,facecolor = 'blue',alpha = 0.1)
plt.title('Daily high temperatures, july 2014', fontsize=24)
plt.xlabel('', fontsize=16)
plt.ylabel('temperature (F)', fontsize=16)
#避免标签重叠
fig.autofmt_xdate()
plt.tick_params(axis='both',which = 'major ',labelsize = 16)
plt.show()
进行最低温和最高温的比较,同时运用try-except工具,这里死亡大峡谷的其中数据是缺失的,为了让其程序不会停止,我们用到try-except。