android使用hellocharts框架画折线图
首先附上hellocharts框架地址,我也是通过下载那个demo进行理解性测试学习的,可能会有没有考虑到的地方,还请指出。如果想更深一步了解这个框架,可以下载Demo自己去学习一下。
废话少说,上效果图:


第一步:导入依赖包
implementation 'com.github.lecho:hellocharts-android:v1.5.8'
第二步:配置xml文件
这里还是比较简单,没有什么好说的
<androidx.constraintlayout.widget.ConstraintLayout
    xmlns:android="http://schemas.android.com/apk/res/android"
    xmlns:app="http://schemas.android.com/apk/res-auto"
    xmlns:tools="http://schemas.android.com/tools"
    android:layout_width="match_parent"
    android:layout_height="match_parent"
    tools:context=".LineChartActivity" >

    <lecho.lib.hellocharts.view.LineChartView
        android:id="@+id/chart"
        android:layout_width="match_parent"
        android:layout_height="200dp"
        android:layout_marginBottom="100dp"
        app:layout_constraintBottom_toBottomOf="parent"
        app:layout_constraintEnd_toEndOf="parent"
        app:layout_constraintStart_toStartOf="parent"
        app:layout_constraintTop_toTopOf="parent"></lecho.lib.hellocharts.view.LineChartView>

</androidx.constraintlayout.widget.ConstraintLayout>
第三步:activity代码(重点)
首先附上所有代码,下面进行参数的详解:
import android.graphics.Color;
import android.os.Bundle;
import android.view.LayoutInflater;
import android.view.Menu;
import android.view.MenuInflater;
import android.view.MenuItem;
import android.view.View;
import android.view.ViewGroup;
import android.widget.Toast;
import androidx.appcompat.app.AppCompatActivity;
import androidx.fragment.app.Fragment;
import java.util.ArrayList;
import java.util.List;
import lecho.lib.hellocharts.animation.ChartAnimationListener;
import lecho.lib.hellocharts.gesture.ZoomType;
import lecho.lib.hellocharts.listener.LineChartOnValueSelectListener;
import lecho.lib.hellocharts.model.Axis;
import lecho.lib.hellocharts.model.AxisValue;
import lecho.lib.hellocharts.model.Line;
import lecho.lib.hellocharts.model.LineChartData;
import lecho.lib.hellocharts.model.PointValue;
import lecho.lib.hellocharts.model.ValueShape;
import lecho.lib.hellocharts.model.Viewport;
import lecho.lib.hellocharts.util.ChartUtils;
import lecho.lib.hellocharts.view.Chart;
import lecho.lib.hellocharts.view.LineChartView;
public class LineChartActivity extends AppCompatActivity {
private LineChartView chart;
private final int maxNumberOfLines = 4;
private final int numberOfPoints = 6;
private final int number=60;
float[][] randomNumbersTab = new float[maxNumberOfLines][numberOfPoints];
private ValueShape shape = ValueShape.CIRCLE;
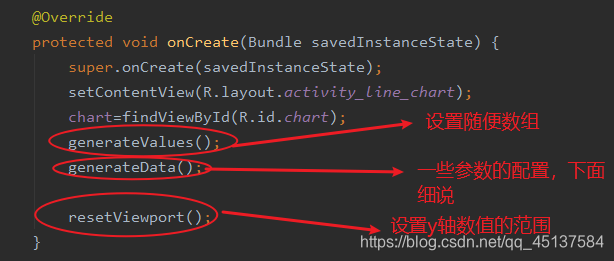
@Override
protected void onCreate(Bundle savedInstanceState) {
super.onCreate(savedInstanceState);
setContentView(R.layout.activity_line_chart);
chart=findViewById(R.id.chart);
generateValues();
generateData();
resetViewport();
}
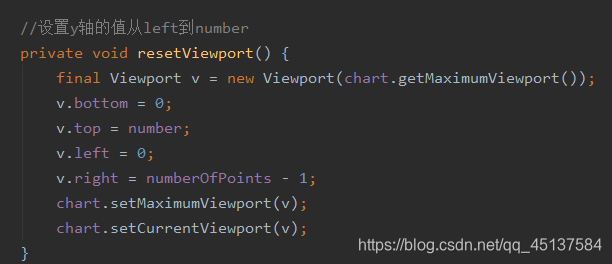
//设置y轴的值从left到number
private void resetViewport() {
final Viewport v = new Viewport(chart.getMaximumViewport());
v.bottom = 0;
v.top = number;
v.left = 0;
v.right = numberOfPoints - 1;
chart.setMaximumViewport(v);
chart.setCurrentViewport(v);
}
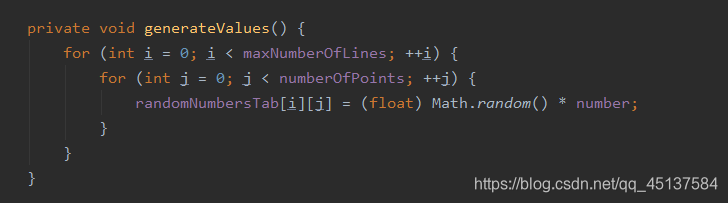
private void generateValues() {
for (int i = 0; i < maxNumberOfLines; ++i) {
for (int j = 0; j < numberOfPoints; ++j) {
randomNumbersTab[i][j] = (float) Math.random() * number;
}
}
}
private void generateData() {
List<Line> lines = new ArrayList<Line>();
List<AxisValue> axisXValues = new ArrayList<AxisValue>();
for (int i = 0; i <= numberOfPoints; i++)
axisXValues.add(i, new AxisValue(i).setLabel(i + "月"));
int numberOfLines = 1;
for (int i = 0; i < numberOfLines; ++i) {
List<PointValue> values = new ArrayList<PointValue>();
for (int j = 0; j < numberOfPoints; j++) {
values.add(new PointValue(j, randomNumbersTab[i][j]));
}
Line line = new Line(values);
line.setColor(ChartUtils.pickColor()); //设置颜色随机
line.setShape(shape); //设置形状
line.setCubic(true); //设置线为曲线,反之为折线
line.setFilled(true); //设置填满
line.setHasLabels(true); //显示便签
line.setHasLabelsOnlyForSelected(true);
line.setHasLines(true);
line.setHasPoints(true);
lines.add(line);
}
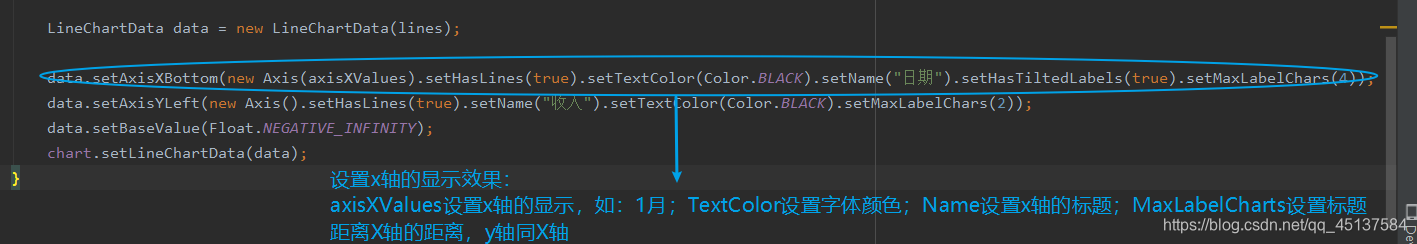
LineChartData data = new LineChartData(lines);
data.setAxisXBottom(new Axis(axisXValues).setHasLines(true).setTextColor(Color.BLACK).setName("日期").setHasTiltedLabels(true).setMaxLabelChars(4));
data.setAxisYLeft(new Axis().setHasLines(true).setName("收入").setTextColor(Color.BLACK).setMaxLabelChars(2));
data.setBaseValue(Float.NEGATIVE_INFINITY);
chart.setLineChartData(data);
}
}
1.先对整体有一个了解
2.细说
1.resetViewport方法
设置y轴的值从0到number,number我设置为60。
2.generateValues方法
生成0到60的随机数,maxNumberOfLines设置折线数我设置为一条,numberOfPoints设置点的个数我设置为6
3.generateData方法(重点)内容最多
图解:

我考虑的可能不是很周到,可以多试一下,说不定可以了解到更多功能。
如果有时间的话,我将会说一下统计图,扇形图等图的实现等。