import matplotlib.pyplot as plt
square = [1,4,9,16,25]
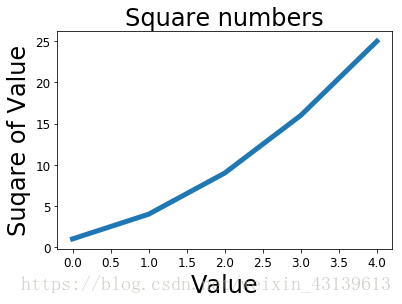
plt.plot(square,linewidth = 5)
plt.title('Square numbers',fontsize = 24)
plt.xlabel('Value',fontsize = 24)
plt.ylabel('Suqare of Value',fontsize = 24)
plt.tick_params(axis = 'both',labelsize = 12)
plt.show()
plot折线图
猜你喜欢
转载自blog.csdn.net/weixin_43139613/article/details/82793890
今日推荐
周排行