版权声明:本文为pureszgd原创文章,未经允许不得转载, 要转载请评论留言! https://blog.csdn.net/pureszgd/article/details/83895072
<template>
<div class="charts">
<div id="main" style=" width:100%; height:350px;"></div>
</div>
</template>
<script>
import echarts from 'echarts';
export default {
data() {
return {
chart: null,
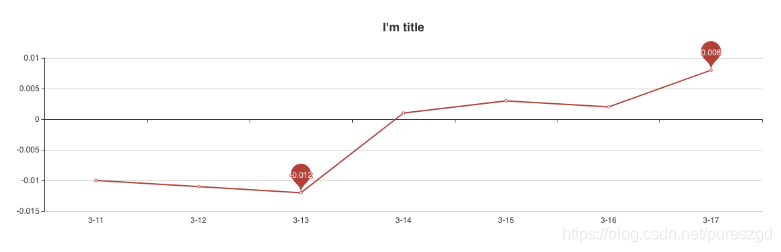
title: "I'm title",
datas: [-0.01, -0.011, -0.012, 0.001, 0.003, 0.002, 0.008],
labels: ['3-11', '3-12', '3-13', '3-14', '3-15', '3-16', '3-17']
}
},
methods: {
drawGraph(id) {
this.chart = echarts.init(document.getElementById(id))
this.chart.showLoading();
var that = this
this.chart.setOption({
title: {
text: this.title,
x: 'center'
},
xAxis: {
type: 'category',
data: this.labels
},
yAxis: {
type: 'value'
},
series: [{
data: this.datas,
type: 'line',
markPoint: {
data: [
{type: 'max'},
{type: 'min'}
]
},
}]
})
this.chart.hideLoading()
}
},
mounted() {
this.$nextTick(function() {
this.drawGraph('main')
})
}
}
</script>