python学习笔记
一、matplotlib的使用(3)
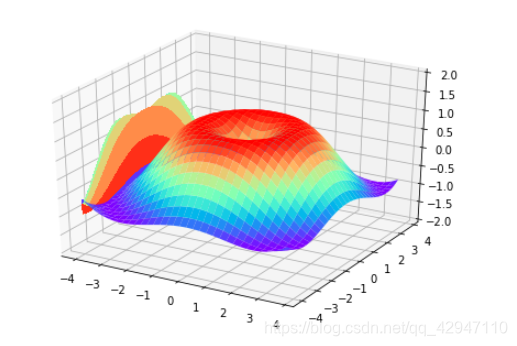
1、3D图
import numpy as np
import matplotlib.pyplot as plt
from mpl_toolkits.mplot3d import Axes3D
#建立3D的网格坐标系
fig =plt.figure()
ax =Axes3D(fig)#生成3D图的坐标系
#X,Y value
X=np.arange(-4,4,0.25)#固定步长的数字序列
Y=np.arange(-4,4,0.25)
X,Y=np.meshgrid(X,Y)#生成网格坐标矩阵R=np.sqrt(X**2+Y**2)
Z=np.sin(R)
#绘制3D图,rstride和cstride分别是行跨度和列跨度
ax.plot_surface(X,Y,Z,rstride=1,cstride=1,cmap=plt.get_cmap('rainbow'))
#绘制3D图关于YOZ平面的投影,投影在x=-4的平面上
ax.contourf(X,Y,Z,zdir='x',offset=-4,cmap=plt.get_cmap('rainbow'))ax.set_zlim(-2,2)
plt.show()参考显示结果:
2、subplot小图排列
方法一:
import matplotlib.pyplot as plt

plt.figure()
plt.subplot(2,1,1)#将位置划分为2行1列,共两个位置,占据第一个位置
plt.plot([0,1],[0,1])

plt.subplot(2,3,4)#将位置划分为2行3列,共6个位置,占据第4个位置
plt.plot([0,1],[0,1])

plt.subplot(2,3,5)#将位置划分为2行3列,共6个位置,占据第5个位置
plt.plot([0,1],[0,1])

plt.subplot(2,3,6)#将位置划分为2行3列,共6个位置,占据第6个位置
plt.plot([0,1],[0,1])

plt.show()
显示结果:

方法二:该方法易于理解
import matplotlib.pyplot as plt

plt.figure()
ax1=plt.subplot2grid((3,3),(0,0),colspan=3,rowspan=1)
#将区域划分为3行3列,放置起点为(0,0)即左上角,行跨度为3,列跨度为1
ax1.set_title('ax1')
ax1.plot([1,2],[1,2])
ax2=plt.subplot2grid((3,3),(1,0),colspan=2,rowspan=2)
#将区域划分为3行3列,放置起点为(1,0)即第二行,行跨度为2,列跨度为2
ax2.plot([1,2],[1,2])
ax3=plt.subplot2grid((3,3),(2,2))
#将区域划分为3行3列,放置起点为(2,2),默认行跨度为1,列跨度为1
ax3.plot([1,2],[1,2])

plt.show()
显示结果: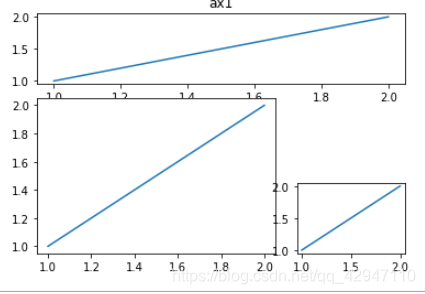
方法三:该方法借助切片法
import matplotlib.pyplot as plt
import matplotlib.gridspec as gridspec

plt.figure()
gs=gridspec.GridSpec(3,3)
ax4=plt.subplot(gs[0,:])
ax5=plt.subplot(gs[1:3,0:2])
ax4=plt.subplot(gs[2,2])

plt.show()
显示结果:
方法四:该方法不能对每个图像的大小进行单独设定,每个图像的大小一致
import matplotlib.pyplot as plt
f,((ax11,ax12),(ax21,ax22))=plt.subplots(2,2,=True,sharey=True)
#sharex为是否共享x轴;sharey为是否共享y轴
ax11.plot([1,2],[1,2])
plt.tight_layout()
plt.show()
显示结果:

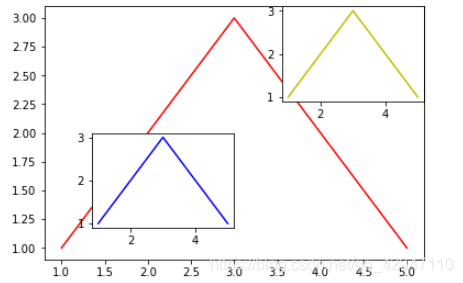
3、图中图
借助于add_axes来添加坐标轴,将坐标轴的大小和位置进行设定即可达到图中图的效果
import matplotlib.pyplot as plt

fig=plt.figure()
x=[1,2,3,4,5]
y=[1,2,3,2,1]

left,bottom,width,height=0.1,0.1,0.8,0.8
ax1=fig.add_axes([left,bottom,width,height])
''left为左轴的位置,bottom为下轴的位置,width为图像的宽度(即下轴的长度),height为图像的高度(即左轴的长度)''
ax1.plot(x,y,'r')

ax2=fig.add_axes([0.2,0.2,0.3,0.3])
ax2.plot(x,y,'b')

plt.axes([0.6,0.6,0.3,0.3])
plt.plot(x,y,'y')

plt.show()
显示结果: