Matlab K-means聚类算法对多光谱遥感图像进行分类
作者: 白艺亭
测试了下matlab自带kmeans函数,作者编写函数,以及ENVI下的Kmeans方法,对比其效果,代码及结果图展示见下。(K均值聚类的matlab代码,对其算法进行实现。)
1. K-Means无监督聚类算法:
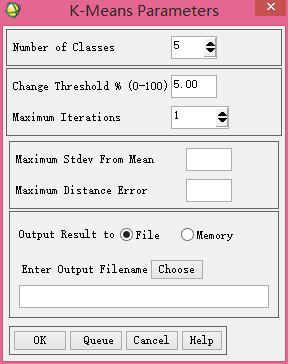
ENVI中,在主菜单上,选择Classification>>Unsupervised>>K-Means,在Classification Input File中选择TM影像,单击OK。打开K-means Parameters对话框中,设置以下的参数:
1)分类数量(Number of Classes):一般为最终输出分类数量的2-3倍。
2)变换阈值(Change Threshold):5。每当一类的变化像元数小于阈值时,结束迭代过程。这个值越小得到的结果越精确,运算量也越大。
3)最大迭代次数(Maximum Iterations):30(我选的).迭代次数越大,精度越高。
4)距离类别的值的最大误差(Maximum Stdev From Mean)。此数可选。
5)允许的最大距离误差:(Maximum Distance Error);可选
6)选择路径,OK执行。
以上参考东腾的博客。
2. 自编matlab函数实现
2.1被调function
function [new_class_label] = Kmeans_of_muldim(data,k,change_threshold,iteration)
% 功能:实现多光谱遥感数据非监督分类算法之K-means聚类算法
%Author: Mr. BAI
% 输入:data是s*fl*b的矩阵,s为列数(sample),fl为行数(fileline),b为波段数(band);
%       k 为类别数,如果有背景值,背景值会归到某一地类中去,到时再用矢量边界图形裁剪一下即可。我考虑过将出现次数最多
%       的背景值单独划归一类,但是程序设计时不好判断,取数组中元素出现次数最多的像元为一类,有点大胆,因为无背
%       景的图像像元值也可能出现这种情况;
%       change_threshold变化阈值,ENVI中默认为0.05;
%       iteration为最大迭代次数,ENVI中默认为1
% 输出:new_class_label为聚类后的矩阵,赋予每个行列号一个类别标签,之后可在GIS或者ENVI中出图
% Reference:https://www.cnblogs.com/dongteng/p/5415071.html
    [fl,s,b] = size(data);
    %original_seed为迭代前的种子,存放一个k行,b个波段数值列的数组
    old_seed = zeros(k,b);
    %newseed为迭代后的新种子,存放一个k行,b个波段数值列的数组
    new_seed = zeros(k,b);
    %-------------------------------------------------------------------------------------------------
    % 产生k个随机种子作为遥感图像各地物类别的种子像元
    %-------------------------------------------------------------------------------------------------
    index_record = zeros(1,k);
    for i = 1:k
        index_i = round(rand()*fl*s);
        judge = find(index_record == index_i);
        %如果已经有这个值了,那么重新循环取值
        if isempty(judge) == 0
            i = i-1;
            continue;
        end
        index_record(i) = index_i;
        %计算取到的随机值对应图像的行列号
        fl_index = floor(index_i/s);%行号
        sample_index = index_i - fl_index*s;%列号
        %将该种子像元的b个波段值存入
        old_seed(i,:) = data(fl_index,sample_index,:);
    end
    %--------------------------------------------------------------------------------------
    % 下面进行迭代,如果本次分别所有类新得到的像元数目变化在change_threshold内,则认为分类完毕。
    %--------------------------------------------------------------------------------------
    n = 1;
    new_class_label = zeros(fl,s);
    while n
        distance_matrix = zeros(fl,s,k);
        for kind = 1:k
            sum = 0;
            for i=1:b
               temp = power(abs(data(:,:,i)-old_seed(kind,i)),2);
               sum = sum+temp;
            end
            %每个像元与初始7个类别中心的欧式距离
            ou_distance = sqrt(sum);
            distance_matrix(:,:,kind) = ou_distance;
        end
        %给给各类别赋值类别标注
        for i=1:fl
            for j=1:s
                currentpixel_vector = distance_matrix(i,j,:);
                currentpixel_class = find(currentpixel_vector == min(currentpixel_vector));
                new_class_label(i,j) = currentpixel_class(1);
            end
        end
        %计算新的各类别中心
        for i=1:k
            id = find(new_class_label==i);
            for j=1:b
                temp1 = data(:,:,j);
                temp2 = temp1(id);
                new_seed(i,j)= mean(temp2(:));
            end
        end
        new_class_pixcel_number = zeros(1,k);
        for i=1:k
            new_class_pixcel_number(i) = length(find(new_class_label(:)==i));
        end
        %Change threshold:0.05
        if n == 1
            old_class_pixcel_number = ones(1,k);
        end
        %size(new_class_pixcel_number)
        if max(abs((new_class_pixcel_number-old_class_pixcel_number)./old_class_pixcel_number)) < change_threshold || n>iteration
            break;
        end
        n=n+1;
        if max(abs((new_class_pixcel_number-old_class_pixcel_number)./old_class_pixcel_number)) >change_threshold
            %old_class_label = new_class_label;
            old_class_pixcel_number = new_class_pixcel_number;
            old_seed = new_seed;
            continue;
        end
    end
end
2.2 main函数调用上述function
clc;
clear;
t0 = cputime;
cd 'E:\MATLAB\'
data=imread('nantong_city_landsat8.tif');%读取纯数据
[multi_data,r]=geotiffread('nantong_city_landsat8.tif');  % read the geo information
info=geotiffinfo('nantong_city_landsat8.tif');   % read the geo information
class_result = Kmeans_of_muldim(data,5,0.05,30);
geotiffwrite('K-means_class.tif',class_result,r,'GeoKeyDirectoryTag',info.GeoTIFFTags.GeoKeyDirectoryTag);
t1 = cputime;
during = t1 - t0;
disp('耗时:');
disp(during);
耗时:
                 139.59375
时间长是因为程序中Kmeans_of_muldim()函数中使用了逐像元循环,用了139秒,后面附上改进的算法, MKmeans_of_muldim(),Matlab K-means聚类算法改进对多光谱遥感图像进行分类(二)。
3 matlab库中的kmeans()
clc;
clear;
%matlab自带的kmeans使用方法:
t0 = cputime;
cd 'E:\MATLAB\'
data=imread('nantong_city_landsat8.tif');%读取纯数据
[multi_data,r]=geotiffread('nantong_city_landsat8.tif');  % read the geo information
info=geotiffinfo('nantong_city_landsat8.tif');   % read the geo information
[fl,s,b] = size(data);
dat = zeros(fl*s,b);%matlab K-means算法要求输入矩阵是一个列向量组成的矩阵,列数为波段数,每一列为fl*s的像元值
for i=1:b
    dat(:,i) = reshape(data(:,:,i),fl*s,1);
end
class_result = kmeans(dat,5);只能传两参
out_data = reshape(class_result,fl,s);
geotiffwrite('K-means_class_matlab.tif',out_data,r,'GeoKeyDirectoryTag',info.GeoTIFFTags.GeoKeyDirectoryTag);
t1 = cputime;
during = t1 - t0;
disp('耗时:');
disp(during);
耗时:
                 38.796875
4 结果展示
4.1ENVI操作结果展示:
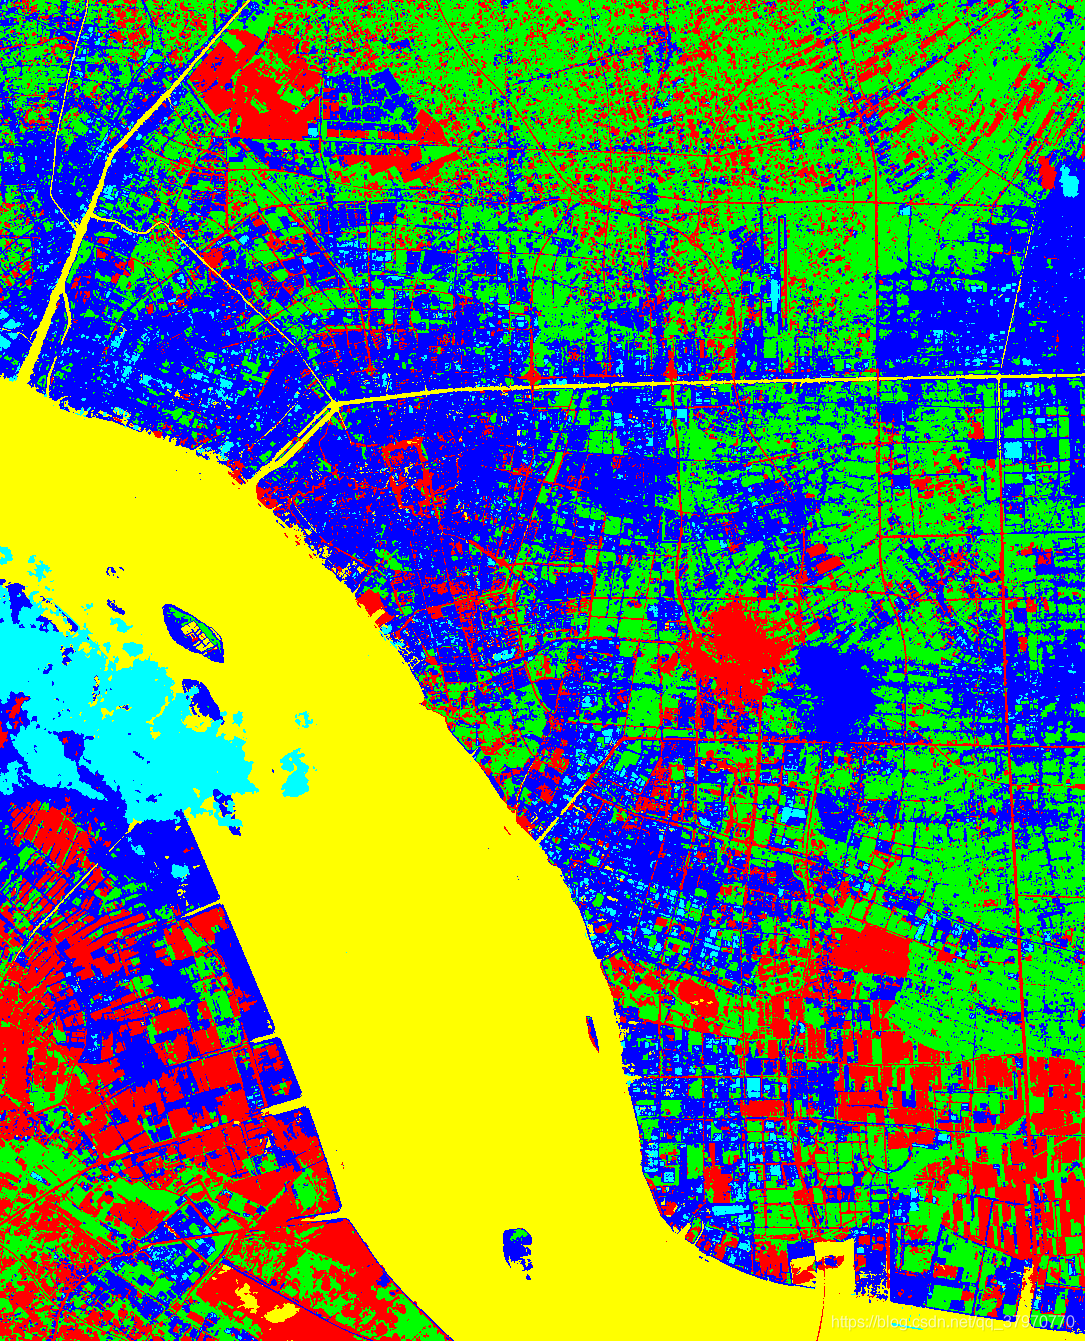
0.05,30.
4.2 Kmeans_of_muldim,作者的matlab代码结果展示:

0.05,30
4.3K-means matlab自带函数结果展示:

效果相当,下面对Kmeans_of_muldim进行改进。
见下一篇:
Matlab K-means聚类算法改进对多光谱遥感图像进行分类(二)
后来,我们都学会了勇敢,不遗憾,不留恋。417看完了刘若英的线上演唱会,1500w人同时在线的,很壮观。