<UserControlx:Class="Wpf.CartesianChart.MultiAxesChart"xmlns="http://schemas.microsoft.com/winfx/2006/xaml/presentation"xmlns:x="http://schemas.microsoft.com/winfx/2006/xaml"xmlns:mc="http://schemas.openxmlformats.org/markup-compatibility/2006"xmlns:d="http://schemas.microsoft.com/expression/blend/2008"xmlns:local="clr-namespace:Wpf.CartesianChart"xmlns:lvc="clr-namespace:LiveCharts.Wpf;assembly=LiveCharts.Wpf"mc:Ignorable="d"d:DesignHeight="300"d:DesignWidth="300"><Grid><Grid.Resources><Stylex:Key="CleanSeparator"TargetType="lvc:Separator">
<Setter Property="IsEnabled" Value="False"></Setter>
</Style></Grid.Resources><Grid.RowDefinitions><RowDefinitionHeight="Auto"></RowDefinition><RowDefinitionHeight="Auto"></RowDefinition><RowDefinitionHeight="*"></RowDefinition></Grid.RowDefinitions><TextBlockGrid.Row="0"TextWrapping="Wrap">
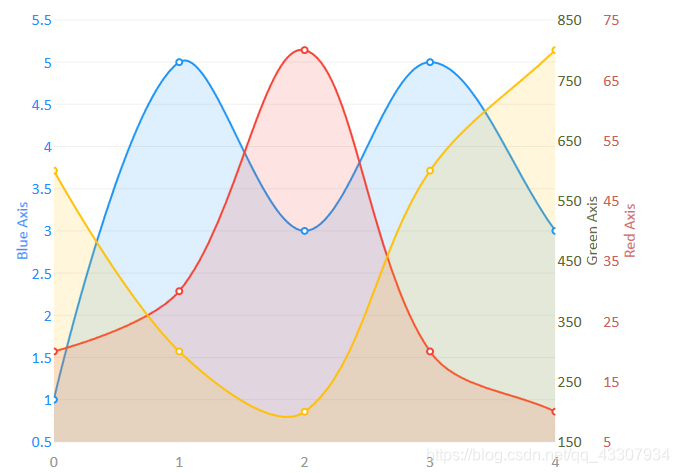
You can create multiple axes, just set the Series.ScalesXAt or Series.ScalesYAt properties, you must also add the axis explicitly.
</TextBlock><lvc:CartesianChartGrid.Row="2"><lvc:CartesianChart.AxisY><lvc:AxisForeground="DodgerBlue"Title="Blue Axis"/><lvc:AxisForeground="IndianRed"Title="Red Axis"Position="RightTop"><lvc:Axis.Separator><lvc:SeparatorStyle="{StaticResource CleanSeparator}"></lvc:Separator></lvc:Axis.Separator></lvc:Axis><lvc:AxisForeground="DarkOliveGreen"Title="Green Axis"Position="RightTop"><lvc:Axis.Separator><lvc:SeparatorStyle="{StaticResource CleanSeparator}"></lvc:Separator></lvc:Axis.Separator></lvc:Axis></lvc:CartesianChart.AxisY><lvc:CartesianChart.Series><lvc:LineSeriesValues="1,5,3,5,3"ScalesYAt="0"/><!--Scales at blue axis, Axis[0]--><lvc:LineSeriesValues="20,30,70,20,10"ScalesYAt="1"/><!--Scales at red axis, Axis[1]--><lvc:LineSeriesValues="600,300,200,600,800"ScalesYAt="2"/><!--Scales at green axis, Axis[2]--></lvc:CartesianChart.Series></lvc:CartesianChart></Grid></UserControl>