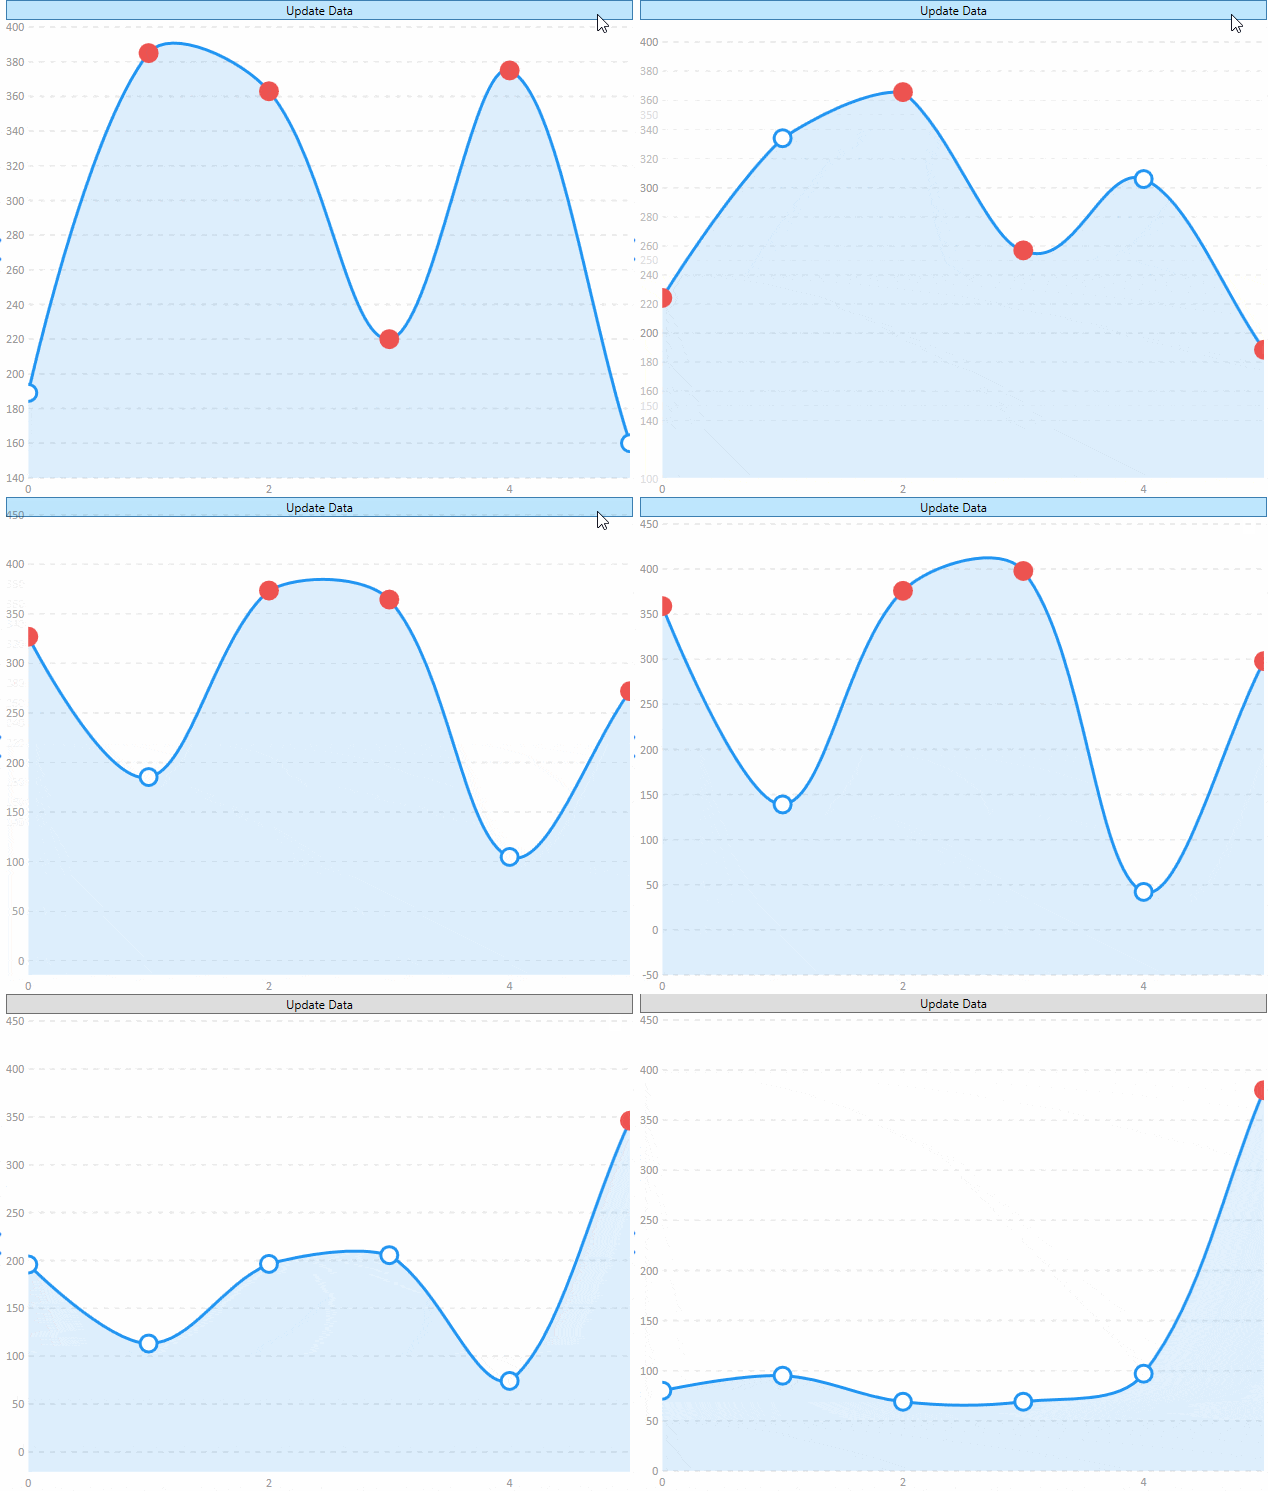
此示例在其值大于200时突出显示一个点,它使用线系列,但是库中的所有系列都支持此功能。

后台:
using System;
using System.Windows;
using System.Windows.Controls;
using System.Windows.Media;
using LiveCharts;
using LiveCharts.Configurations;
using LiveCharts.Defaults;
namespace Wpf.CartesianChart.PointState
{
public partial class PointStateExample : UserControl
{
public PointStateExample()
{
InitializeComponent();
var r = new Random();
Values = new ChartValues<ObservableValue>
{
new ObservableValue(r.Next(10, 400)),
new ObservableValue(r.Next(10, 400)),
new ObservableValue(r.Next(10, 400)),
new ObservableValue(r.Next(10, 400)),
new ObservableValue(r.Next(10, 400)),
new ObservableValue(r.Next(10, 400))
};
Mapper = Mappers.Xy<ObservableValue>()
.X((item, index) => index)
.Y(item => item.Value)
.Fill(item => item.Value > 200 ? DangerBrush : null)
.Stroke(item => item.Value > 200 ? DangerBrush : null);
Formatter = x => x + " ms";
DangerBrush = new SolidColorBrush(Color.FromRgb(238,83,80));
DataContext = this;
}
public Func<double, string> Formatter { get; set; }
public ChartValues<ObservableValue> Values { get; set; }
public Brush DangerBrush { get; set; }
public CartesianMapper<ObservableValue> Mapper { get; set; }
private void UpdateDataOnClick(object sender, RoutedEventArgs e)
{
var r = new Random();
foreach (var observable in Values)
{
observable.Value = r.Next(10, 400);
}
}
}
}
前台:
<UserControl x:Class="Wpf.CartesianChart.PointState.PointStateExample"
             xmlns="http://schemas.microsoft.com/winfx/2006/xaml/presentation"
             xmlns:x="http://schemas.microsoft.com/winfx/2006/xaml"
             xmlns:mc="http://schemas.openxmlformats.org/markup-compatibility/2006"
             xmlns:d="http://schemas.microsoft.com/expression/blend/2008"
             xmlns:lvc="clr-namespace:LiveCharts.Wpf;assembly=LiveCharts.Wpf"
             xmlns:pointState="clr-namespace:Wpf.CartesianChart.PointState"
             mc:Ignorable="d"
             d:DesignHeight="300" d:DesignWidth="300" d:DataContext="{d:DesignInstance pointState:PointStateExample}">
    <Grid>
        <Grid.RowDefinitions>
            <RowDefinition Height="Auto"></RowDefinition>
            <RowDefinition Height="*"></RowDefinition>
        </Grid.RowDefinitions>
        <Button Grid.Row="0" Click="UpdateDataOnClick">Update Data</Button>
        <lvc:CartesianChart Grid.Row="1">
            <lvc:CartesianChart.Series>
                <lvc:LineSeries Values="{Binding Values}"
                                PointGeometrySize="20"
                                PointForeground="White"
                                Configuration="{Binding Mapper}"/>
            </lvc:CartesianChart.Series>
        </lvc:CartesianChart>
    </Grid>
</UserControl>
