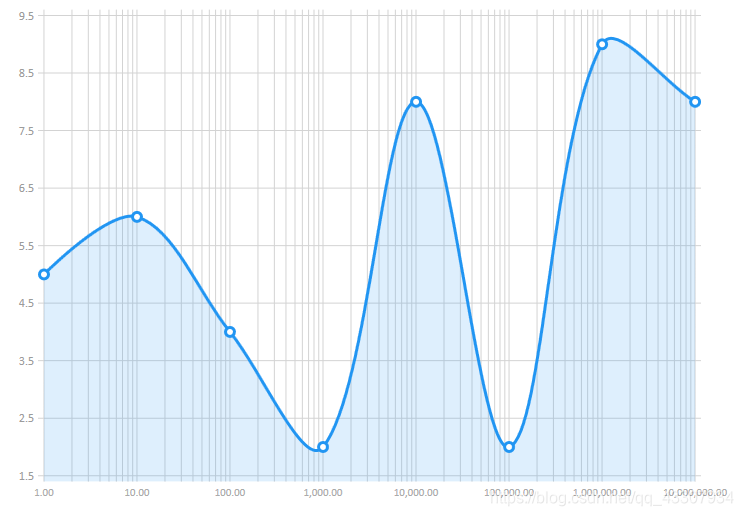
LiveCharts映射器使此操作变得容易,所有您需要做的就是在映射器中配置比例,就像通常配置其他任何图表一样。
后台:
using System;
using System.Windows.Controls;
using LiveCharts;
using LiveCharts.Configurations;
using LiveCharts.Defaults;
using LiveCharts.Wpf;
namespace Wpf.CartesianChart.LogarithmScale
{
public partial class LogarithmScaleExample : UserControl
{
public LogarithmScaleExample()
{
InitializeComponent();
Base = 10;
var mapper = Mappers.Xy<ObservablePoint>()
.X(point => Math.Log(point.X, Base))
.Y(point => point.Y);
SeriesCollection = new SeriesCollection(mapper)
{
new LineSeries
{
Values = new ChartValues<ObservablePoint>
{
new ObservablePoint(1, 5),
new ObservablePoint(10, 6),
new ObservablePoint(100, 4),
new ObservablePoint(1000, 2),
new ObservablePoint(10000, 8),
new ObservablePoint(100000, 2),
new ObservablePoint(1000000, 9),
new ObservablePoint(10000000, 8)
}
}
};
Formatter = value => Math.Pow(Base, value).ToString("N");
DataContext = this;
}
public SeriesCollection SeriesCollection { get; set; }
public Func<double, string> Formatter { get; set; }
public double Base { get; set; }
}
}
前台:
<UserControl x:Class="Wpf.CartesianChart.LogarithmScale.LogarithmScaleExample"
             xmlns="http://schemas.microsoft.com/winfx/2006/xaml/presentation"
             xmlns:x="http://schemas.microsoft.com/winfx/2006/xaml"
             xmlns:mc="http://schemas.openxmlformats.org/markup-compatibility/2006"
             xmlns:d="http://schemas.microsoft.com/expression/blend/2008"
             xmlns:local="clr-namespace:Wpf.CartesianChart.LogarithmScale"
             xmlns:lvc="clr-namespace:LiveCharts.Wpf;assembly=LiveCharts.Wpf"
             mc:Ignorable="d"
             d:DesignHeight="300" d:DesignWidth="300">
    <Grid>
        <lvc:CartesianChart Series="{Binding SeriesCollection}">
            <lvc:CartesianChart.Resources>
                <Style TargetType="lvc:Separator">
                    <Setter Property="Stroke" Value="LightGray"></Setter>
                </Style>
            </lvc:CartesianChart.Resources>
            <lvc:CartesianChart.AxisX>
                <lvc:LogarithmicAxis LabelFormatter="{Binding Formatter}"
                                     Base="{Binding Base}" >
                    <lvc:LogarithmicAxis.Separator>
                        <lvc:Separator StrokeThickness="1" IsEnabled="True"></lvc:Separator>
                    </lvc:LogarithmicAxis.Separator>
                </lvc:LogarithmicAxis>
            </lvc:CartesianChart.AxisX>
        </lvc:CartesianChart>
    </Grid>
</UserControl>