using System;using System.ComponentModel;using System.Windows;using System.Windows.Controls;using LiveCharts;using Wpf.Annotations;namespace Wpf.CartesianChart.ManualZAndP
{publicpartialclassManualZAndPExample:UserControl, INotifyPropertyChanged
{privatedouble _to;privatedouble _from;publicManualZAndPExample(){InitializeComponent();
Values =newChartValues<double>();var r =newRandom();for(var i =0; i <100; i++){
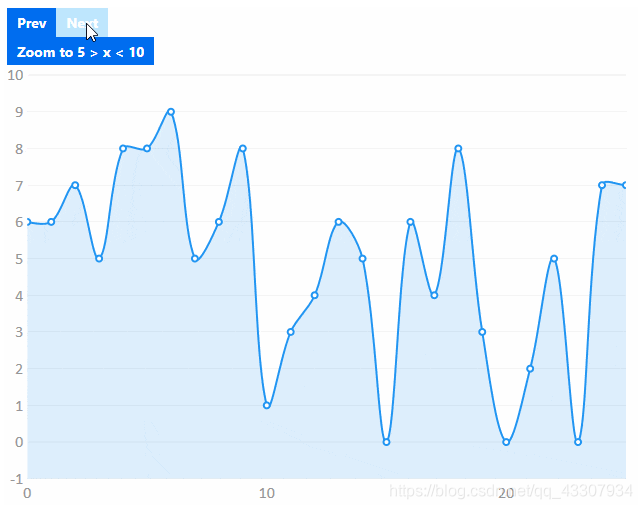
Values.Add(r.Next(0,10));}//In this case we are paginating the data only showing the first 25 records//clicking the buttons previous and next changes the page
From =0;
To =25;
DataContext =this;}public ChartValues<double> Values {get;set;}publicdouble From
{get{return _from;}set{
_from =value;OnPropertyChanged("From");}}publicdouble To
{get{return _to;}set{
_to =value;OnPropertyChanged("To");}}publiceventPropertyChangedEventHandler PropertyChanged;protectedvirtualvoidOnPropertyChanged(string propertyName =null){if(PropertyChanged !=null)
PropertyChanged.Invoke(this,newPropertyChangedEventArgs(propertyName));}privatevoidNextOnClick(object sender,RoutedEventArgs e){
From +=25;
To +=25;}privatevoidPrevOnClick(object sender,RoutedEventArgs e){
From -=25;
To -=25;}privatevoidManualZoom(object sender,RoutedEventArgs e){//you only need to change the axis limits to zoom in/out any axis.
From =5;
To =10;}}}
前台:
<UserControlx:Class="Wpf.CartesianChart.ManualZAndP.ManualZAndPExample"xmlns="http://schemas.microsoft.com/winfx/2006/xaml/presentation"xmlns:x="http://schemas.microsoft.com/winfx/2006/xaml"xmlns:mc="http://schemas.openxmlformats.org/markup-compatibility/2006"xmlns:d="http://schemas.microsoft.com/expression/blend/2008"xmlns:local="clr-namespace:Wpf.CartesianChart.ManualZAndP"xmlns:lvc="clr-namespace:LiveCharts.Wpf;assembly=LiveCharts.Wpf"mc:Ignorable="d"d:DesignHeight="300"d:DesignWidth="300"><Grid><Grid.RowDefinitions><RowDefinitionHeight="Auto"></RowDefinition><RowDefinitionHeight="Auto"></RowDefinition><RowDefinitionHeight="*"></RowDefinition></Grid.RowDefinitions><StackPanelGrid.Row="0"Orientation="Horizontal"><ButtonClick="PrevOnClick">Prev</Button><ButtonClick="NextOnClick">Next</Button></StackPanel><ButtonGrid.Row="1"Click="ManualZoom"HorizontalAlignment="Left">Zoom to 5 > x < 10</Button><lvc:CartesianChartGrid.Row="2"><lvc:CartesianChart.Series><lvc:LineSeriesValues="{Binding Values}"></lvc:LineSeries></lvc:CartesianChart.Series><lvc:CartesianChart.AxisX><lvc:AxisMinValue="{Binding From}"MaxValue="{Binding To}"Separator="{x:Static lvc:DefaultAxes.CleanSeparator}"></lvc:Axis></lvc:CartesianChart.AxisX></lvc:CartesianChart></Grid></UserControl>
Live-Charts
Release Announcements