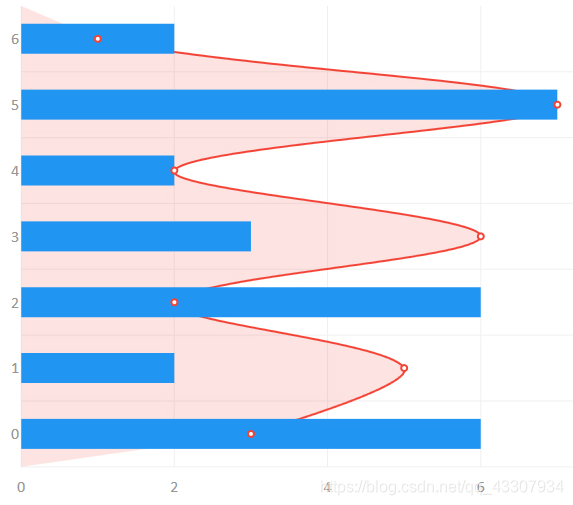
LiveCharts中的反转系列实际上是自动的,您必须使用该系列的反转版本,然后实时图表将处理反转绘图,请注意 垂直和水平序列的配置不同,如果绘制自定义类型,则必须考虑这一点。
实际上,所有系列都有内置的反向版本,例如LineSeries类的反向版本是VerticalLineSeries类
后台
using System.Windows.Controls;
using LiveCharts;

namespace Wpf.CartesianChart.Inverted_Series
{
    public partial class InvertedExample : UserControl
    {
        public InvertedExample()
        {
            InitializeComponent();

            Values1 = new ChartValues<double> {3, 5, 2, 6, 2, 7, 1};

            Values2 = new ChartValues<double> {6, 2, 6, 3, 2, 7, 2};

            DataContext = this;
        }

        public ChartValues<double> Values1 { get; set; }
        public ChartValues<double> Values2 { get; set; }

    }
}
前台
<UserControl x:Class="Wpf.CartesianChart.Inverted_Series.InvertedExample"
             xmlns="http://schemas.microsoft.com/winfx/2006/xaml/presentation"
             xmlns:x="http://schemas.microsoft.com/winfx/2006/xaml"
             xmlns:mc="http://schemas.openxmlformats.org/markup-compatibility/2006"
             xmlns:d="http://schemas.microsoft.com/expression/blend/2008"
             xmlns:local="clr-namespace:Wpf.CartesianChart.Inverted_Series"
             xmlns:lvc="clr-namespace:LiveCharts.Wpf;assembly=LiveCharts.Wpf"
             mc:Ignorable="d"
             d:DesignHeight="300" d:DesignWidth="300">
    <Grid>
        <lvc:CartesianChart>
            <lvc:CartesianChart.Series>
                <lvc:RowSeries Values="{Binding Values2}" Panel.ZIndex="1"></lvc:RowSeries>
                <lvc:VerticalLineSeries Values="{Binding Values1}" Panel.ZIndex="0"></lvc:VerticalLineSeries>
            </lvc:CartesianChart.Series>
            <lvc:CartesianChart.AxisY>
                <lvc:Axis>
                    <lvc:Axis.Separator>
                        <lvc:Separator Step="1"></lvc:Separator>
                    </lvc:Axis.Separator>
                </lvc:Axis>
            </lvc:CartesianChart.AxisY>
            <lvc:CartesianChart.AxisX>
                    <lvc:Axis MinValue="0"></lvc:Axis>
            </lvc:CartesianChart.AxisX>
            <lvc:CartesianChart.DataTooltip>
                <lvc:DefaultTooltip SelectionMode="SharedYValues"></lvc:DefaultTooltip>
            </lvc:CartesianChart.DataTooltip>
        </lvc:CartesianChart>
    </Grid>
</UserControl>