前台:
using System;
using System.Windows.Controls;
using LiveCharts;
using LiveCharts.Wpf;
namespace Wpf.CartesianChart.NegativeStackedRow
{
public partial class NegativeStackedRowExample : UserControl
{
public NegativeStackedRowExample()
{
InitializeComponent();
SeriesCollection = new SeriesCollection
{
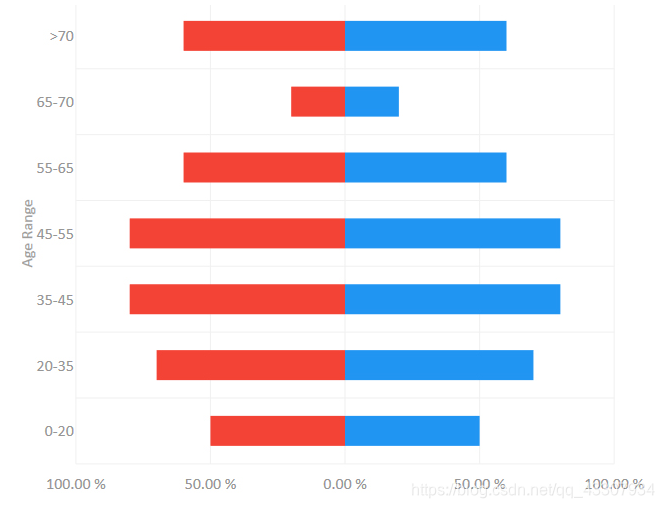
new StackedRowSeries
{
Title = "Male",
Values = new ChartValues<double> {.5, .7, .8, .8, .6, .2, .6}
},
new StackedRowSeries
{
Title = "Female",
Values = new ChartValues<double> {-.5, -.7, -.8, -.8, -.6, -.2, -.6}
}
};
Labels = new[] {"0-20", "20-35", "35-45", "45-55", "55-65", "65-70", ">70"};
Formatter = value => Math.Abs(value).ToString("P");
DataContext = this;
}
public SeriesCollection SeriesCollection { get; set; }
public string[] Labels { get; set; }
public Func<double, string> Formatter { get; set; }
}
}
前台:
<UserControl x:Class="Wpf.CartesianChart.NegativeStackedRow.NegativeStackedRowExample"
             xmlns="http://schemas.microsoft.com/winfx/2006/xaml/presentation"
             xmlns:x="http://schemas.microsoft.com/winfx/2006/xaml"
             xmlns:mc="http://schemas.openxmlformats.org/markup-compatibility/2006"
             xmlns:d="http://schemas.microsoft.com/expression/blend/2008"
             xmlns:local="clr-namespace:Wpf.CartesianChart.NegativeStackedRow"
             xmlns:lvc="clr-namespace:LiveCharts.Wpf;assembly=LiveCharts.Wpf"
             mc:Ignorable="d"
             d:DesignHeight="300" d:DesignWidth="300" d:DataContext="{d:DesignInstance local:NegativeStackedRowExample }">
    <Grid>
        <lvc:CartesianChart Series="{Binding SeriesCollection}">
            <lvc:CartesianChart.AxisX>
                <lvc:Axis LabelFormatter="{Binding Formatter}"></lvc:Axis>
            </lvc:CartesianChart.AxisX>
            <lvc:CartesianChart.AxisY>
                <lvc:Axis Title="Age Range" Labels="{Binding Labels}"></lvc:Axis>
            </lvc:CartesianChart.AxisY>
            <lvc:CartesianChart.DataTooltip>
                <lvc:DefaultTooltip SelectionMode="SharedYValues"></lvc:DefaultTooltip>
            </lvc:CartesianChart.DataTooltip>
        </lvc:CartesianChart>
    </Grid>
</UserControl>