Easyui中DataGrid(数据表格)
1.DataGrid简介
DataGrid以表格形式展示数据,并提供了丰富的选择、排序、分组和编辑数据的功能支持。DataGrid的设计用于缩短开发时间,并且使开发人员不需要具备特定的知识。它是轻量级的且功能丰富。单元格合并、多列标题、冻结列和页脚只是其中的一小部分功能。
2.实现过程
2.1jsp页面的代码块(两种方式)
第一种
从现有的表格元素中创建DataGrid,在HTML中定义列、行和数据
<table class="easyui-datagrid">
    <thead>
        <tr>
            <th data-options="field:'code'">编码</th>
            <th data-options="field:'name'">名称</th>
            <th data-options="field:'price'">价格</th>
        </tr>
    </thead>
    <tbody>
        <tr>
            <td>001</td><td>名称1</td><td>2323</td>
        </tr>
        <tr>
            <td>002</td><td>名称2</td><td>4612</td>
        </tr>
    </tbody>
</table>
通过table标签创建DataGrid控件。在表格内使用th标签定义列。
<table class="easyui-datagrid" style="width:400px;height:250px"
        data-options="url:'datagrid_data.json',fitColumns:true,singleSelect:true">
    <thead>
        <tr>
            <th data-options="field:'code',width:100">编码</th>
            <th data-options="field:'name',width:100">名称</th>
            <th data-options="field:'price',width:100,align:'right'">价格</th>
        </tr>
    </thead>
</table>
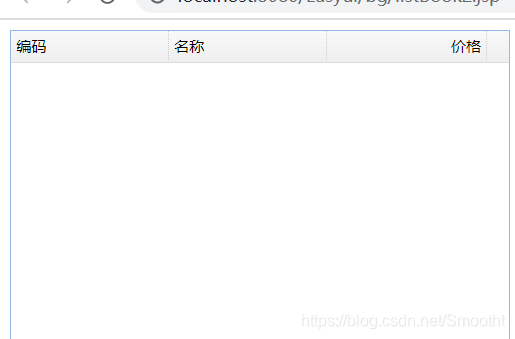
效果图(这是固定的代码块只将表格显示)

第二种
Javascript去创建DataGrid控件。
界面调用代码块
<table id="dg"></table>
js文件中代码块
$('#dg').datagrid({
    url:'datagrid_data.json',
    columns:[[
        {field:'code',title:'代码',width:100},
        {field:'name',title:'名称',width:100},
        {field:'price',title:'价格',width:100,align:'right'}
    ]]
});
效果图
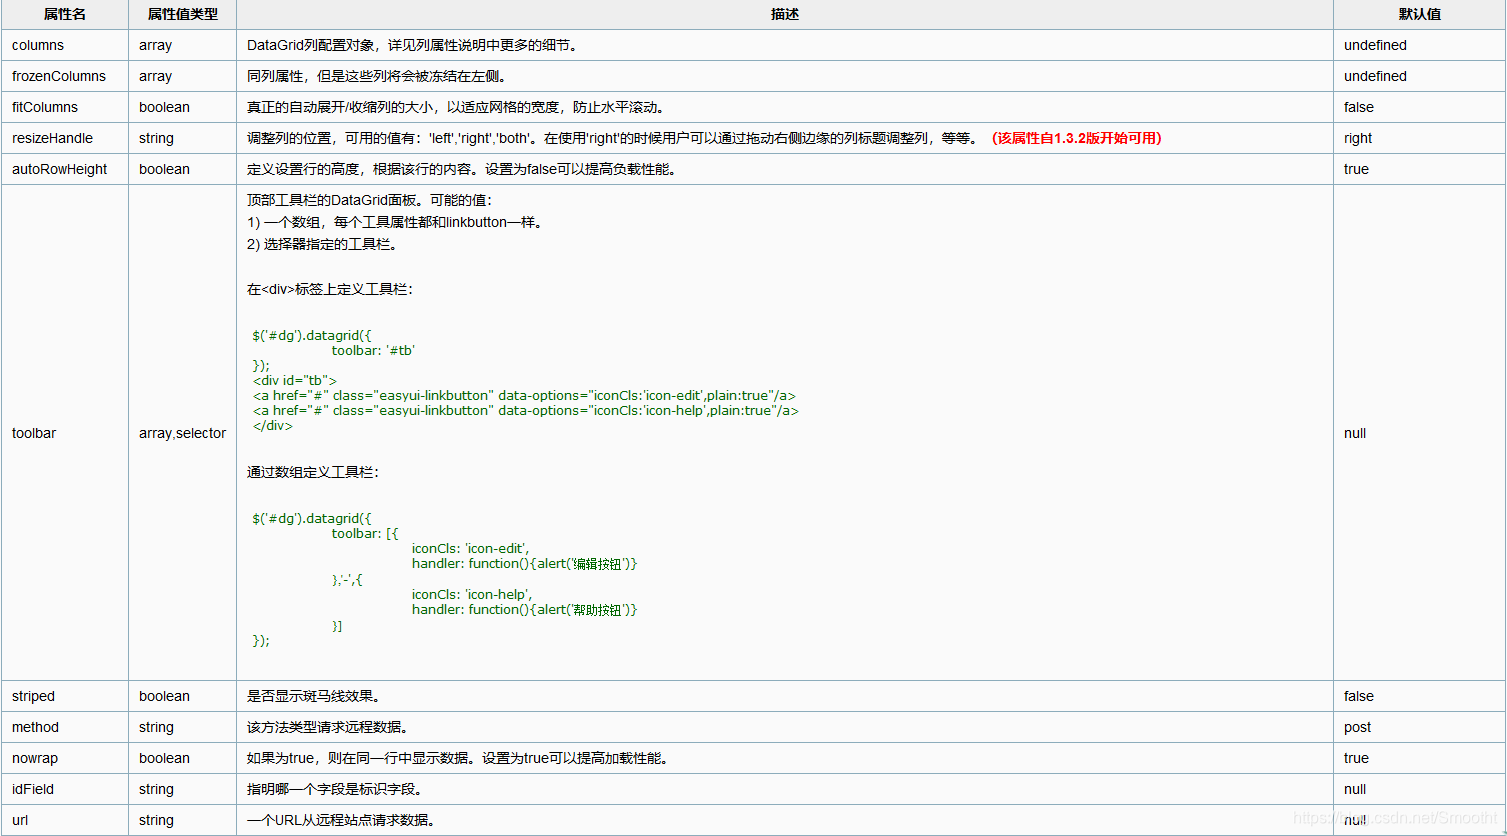
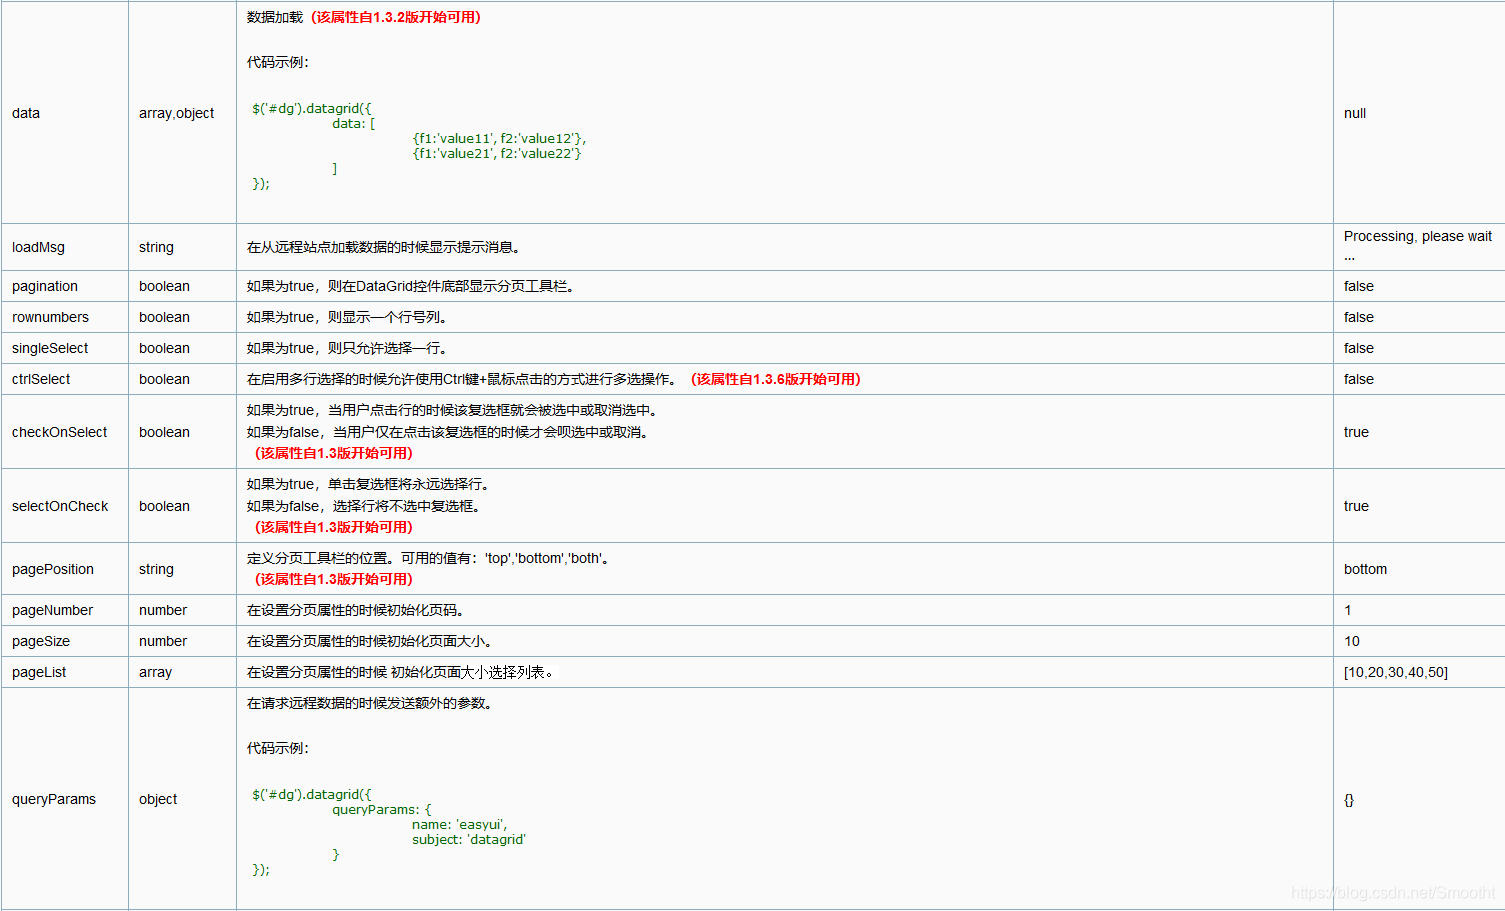
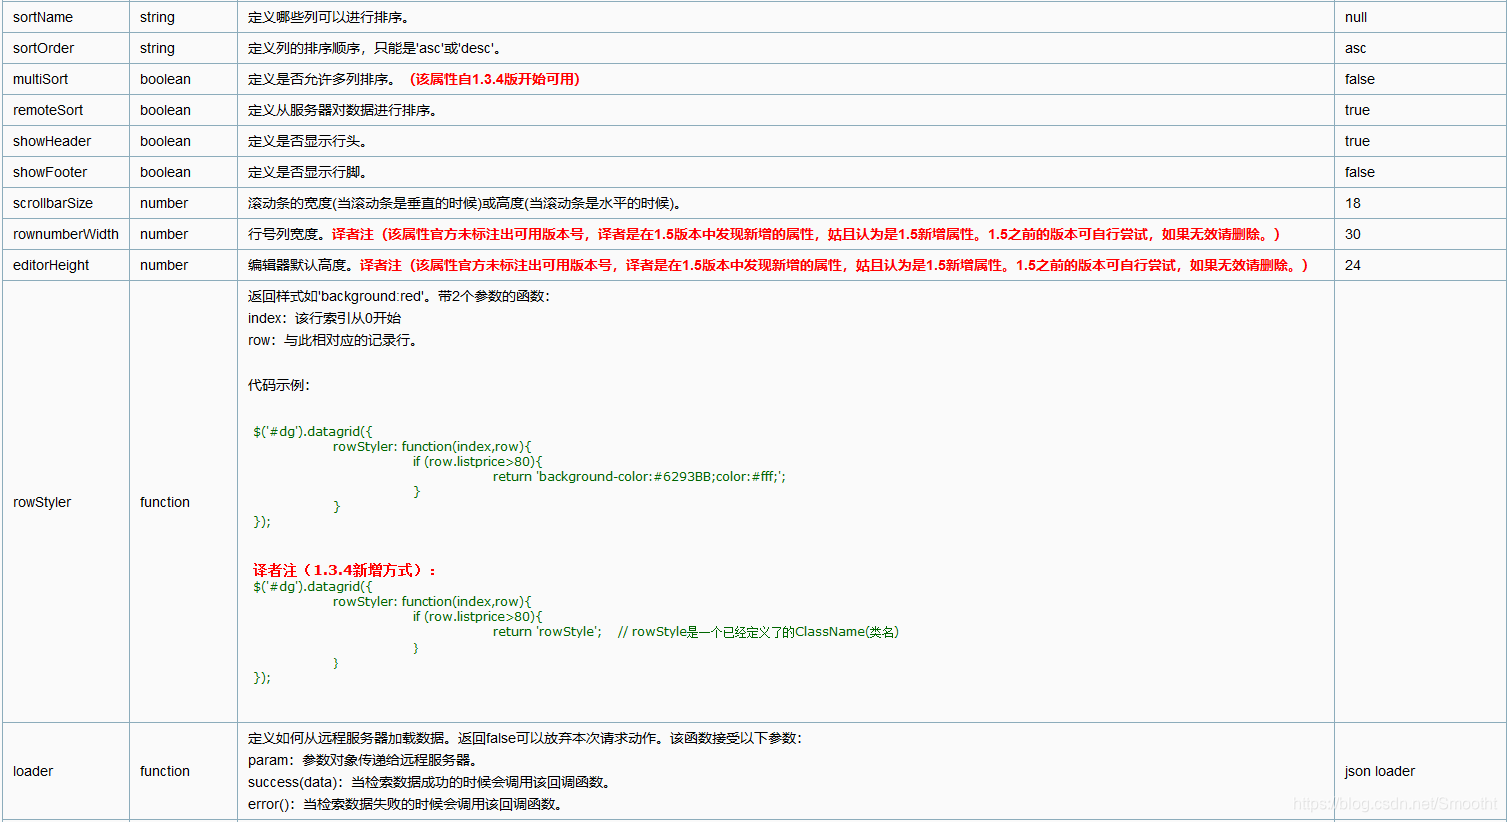
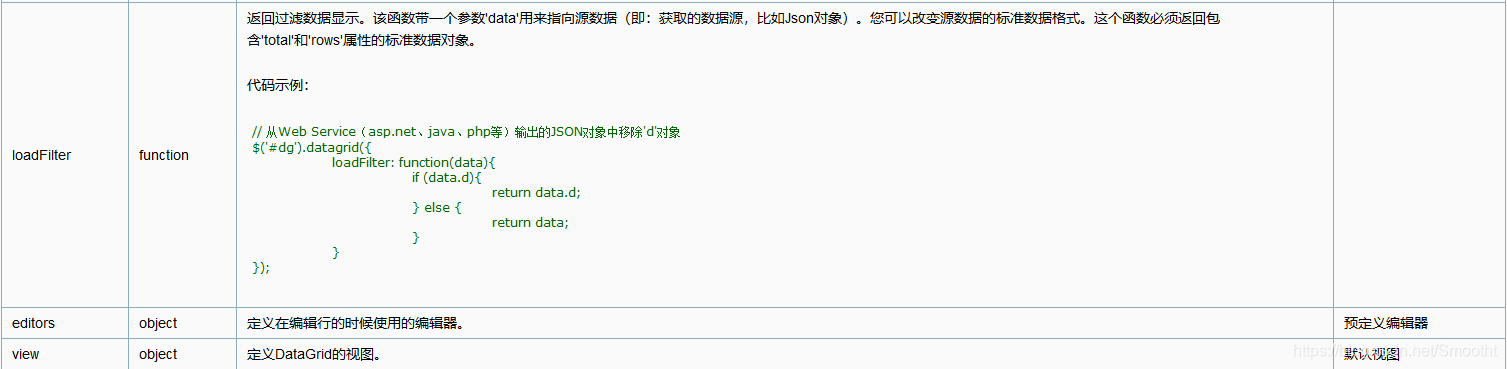
3.DataGrid属性
4.实践操作
4.1界面创建
这里仅写了一个jsp页面
<%@ page language="java" contentType="text/html; charset=UTF-8"
    pageEncoding="UTF-8"%>
<!DOCTYPE html PUBLIC "-//W3C//DTD HTML 4.01 Transitional//EN" "http://www.w3.org/TR/html4/loose.dtd">
<html>
<head>
<!-- 全局样式 -->
<link rel="stylesheet" type="text/css" href="${pageContext.request.contextPath }/static/js/jquery-easyui-1.5.1/themes/default/easyui.css">
<!-- 定义图标 -->
<link rel="stylesheet" type="text/css" href="${pageContext.request.contextPath }/static/js/jquery-easyui-1.5.1/themes/default/easyui.css">
<script type="text/javascript" src="${pageContext.request.contextPath }/static/js/jquery-easyui-1.5.1/jquery.min.js"></script>
<!-- 组件库js源码 -->
<script type="text/javascript" src="${pageContext.request.contextPath }/static/js/jquery-easyui-1.5.1/jquery.easyui.min.js"></script>

<script type="text/javascript" src="${pageContext.request.contextPath }/static/js/index.js"></script>
//这里调用获取数据所写的js
<script type="text/javascript" src="${pageContext.request.contextPath }/static/js/listBook2.js"></script>
<meta http-equiv="Content-Type" content="text/html; charset=UTF-8">
<title>已上架商品</title>
</head>
<body>
<input type="hidden" id="ctx" value="${pageContext.request.contextPath }">
		<table id="dg" style="width: 100%;"></table>

</body>
</html>
4.2js文件
将从数据库查询出来的值进行赋值(具体与数据库字段为准)
field是指属性值(也就是数据查询出来的结果)
$(function(){
	var ctx=$("#ctx" ).val();
	var src=ctx+"/book.action?methodName=booTree";
	$('#dg').datagrid({
	    url:src,
	    columns:[[
	        {field:'id',title:'id',width:120},
	        {field:'name',title:'名称',width:120},
	        {field:'pinyin',title:'拼音',width:120,align:'right'},
	        {field:'cid',title:'书籍类别',width:120,align:'right'},
	        {field:'author',title:'作者',width:120,align:'right'},
	        {field:'price',title:'价格',width:120,align:'right'},
	        {field:'image',title:'图片',width:120,align:'right'},
	        {field:'publishing',title:'出版社',width:120,align:'right'},
	        {field:'description',title:'描述',width:120,align:'right'},
	    ]]
	});

})
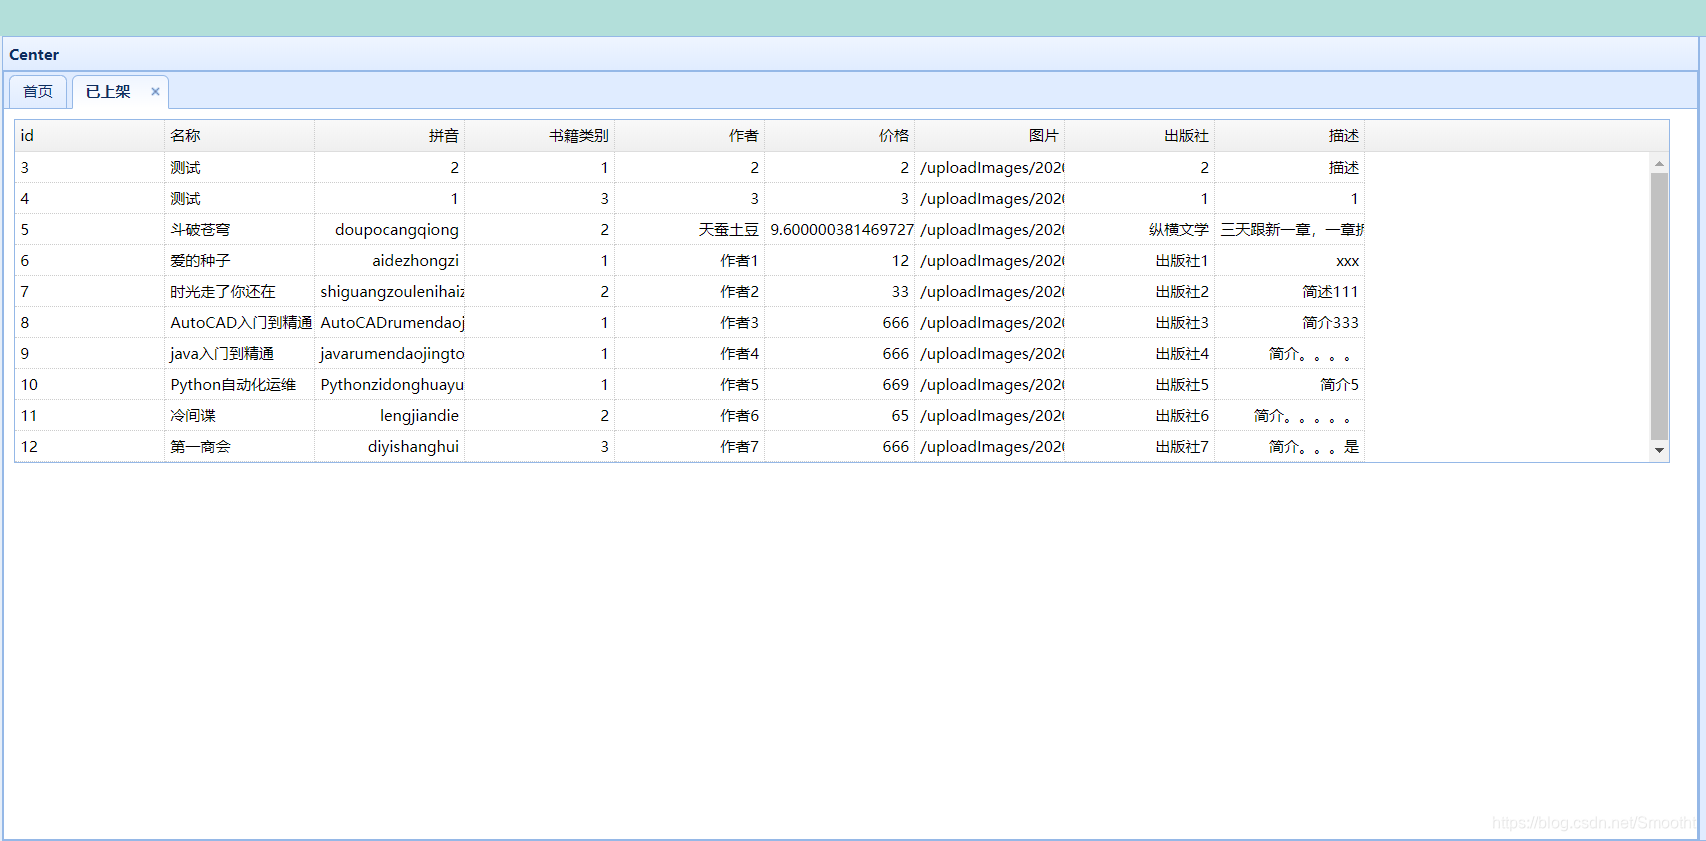
4.3界面效果(此为最简易版本)
5.总结
- 遇到不懂的就去翻阅api文档,找寻所需的方法与属性.
- 感谢观看,有不足之处欢迎指正!