<div id="main"></div>
js部分
<script>
移入echarts
let echarts = require('echarts/lib/echarts')
export default {
mounted () {
this.mein()
},
// 绘制柱状图
methods: {
mein () {
var myChart = this.$echarts.init(document.getElementById('main'))
var option = {
// 设置标题内容样式
title: {
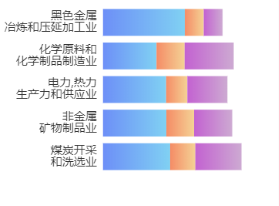
text: '2019年全省各行规上企业数(家)',
标题位置
x: 'center',
标题字体样式
textStyle: {
fontSize: 12,
textAlign: 'center',
color: '#668ff2'
}
},
// 设置柱状图子在页面的位置
grid: {
left: '5%',
right: '10%',
bottom: '5%',
top: '10%',
containLabel: true
},
xAxis: {
// 影藏x轴
show: false
},
yAxis: [{
type: 'category',
show: true,
boundaryGap: true,
axisTick: {// 横轴方向刻度
length: 0
},
splitLine: { // 网格线
show: false
},
axisLine: {// 竖轴方向刻度
show: false
},
axisLabel: {
interval: 0,
fontSize: 15
},
y:轴信息
data: ['煤炭开采\n和洗选业', '非金属\n矿物制品业', '电力,热力\n生产力和供应业', '化学原料和\n化学制品制造业', '黑色金属\n冶炼和压延加工业']
}],
series: [
{
type: 'bar',
stack: '总量',
barGap: '50%',
label: {
normal: {
show: false,
position: 'right',
textStyle: {
color: '#666666' // color of value
}
}
},
itemStyle: {
normal: {
// 柱状图渐变效果
color: new echarts.graphic.LinearGradient(0, 0, 1, 0,
[
{ offset: 0, color: '#6D8FF7' },
{ offset: 1, color: '#80D1F3' }
]
)
}
},
data: [320, 302, 301, 255, 390, 330, 320, 444]
},
{
type: 'bar',
stack: '总量',
barGap: '50%',
label: {
normal: {
show: false,
position: 'right',
textStyle: {
color: '#666666' // color of value
}
}
},
itemStyle: {
normal: {
color: new echarts.graphic.LinearGradient(0, 0, 1, 0,
[
{ offset: 0, color: '#f58c66' },
{ offset: 1, color: '#f4d295' }
]
)
}
},
data: [120, 132, 101, 134, 90, 230, 210, 555]
},
{
type: 'bar',
stack: '总量',
label: {
normal: {
show: false,
position: 'right',
textStyle: {
color: '#666666' // color of value
}
}
},
itemStyle: {
normal: {
color: new echarts.graphic.LinearGradient(0, 0, 1, 0,
[
{ offset: 0, color: '#c362d1' },
{ offset: 1, color: '#cdaad2' }
]
)
}
},
data: [220, 182, 191, 234, 90, 330, 310, 66]
}
]
}
myChart.setOption(option)
}
}
}
</script>
data: [220, 182, 191, 234, 90, 330, 310, 66]
}
]
}
myChart.setOption(option)
}
}
}