#模块导入
import numpy as np
import matplotlib.pyplot as plt
最简单的散点图
high = np.random.randint(1, 100, 10)
weidth = np.random.randint(1, 100, 10)
plt.scatter(high, weidth)
plt.show()
#研究变量相关性
不相关的散点图
N = 1000
x = np.random.randn(N)
y = np.random.randn(N)
plt.scatter(x, y)
plt.show()
正相关的散点图
N = 1000
x = np.random.randn(N)
y = x + np.random.randn(N)*0.5
plt.scatter(x, y)
plt.show()
负相关的散点图
N = 1000
x = np.random.randn(N)
y = -x + np.random.randn(N)*0.5
plt.scatter(x, y)
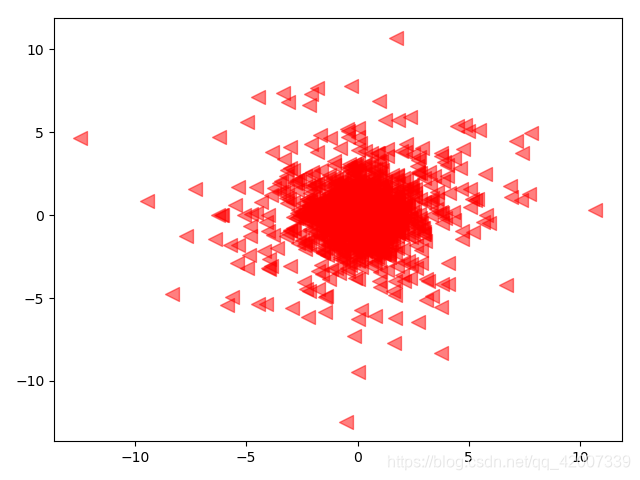
plt.show()open, close = np.loadtxt('000951.csv', delimiter=',', skiprows=1, usecols=(1, 4,), unpack=True)
change = close - open
print(change.shape)
yestoday = change[:-1]
today = change[1:]
plt.scatter(yestoday, today, s=100, c='r', marker='<', alpha=0.5)
plt.show()
#外观调整s表示面积,c表示颜色,marker表示形状,alpha表示透明度越小越透明