1、画单个点
# 散点图
plit.scatter(2, 4,marker='o',c='b')
plit.title("scatter", fontsize=14)
plit.xlabel("x", fontsize=14)
plit.ylabel("y", fontsize=14)
plit.ticklabel_format(axis='both')
plit.show()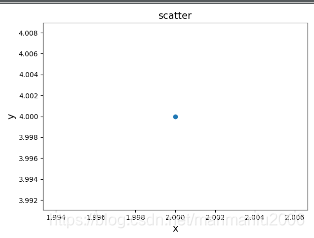
marker的类型:
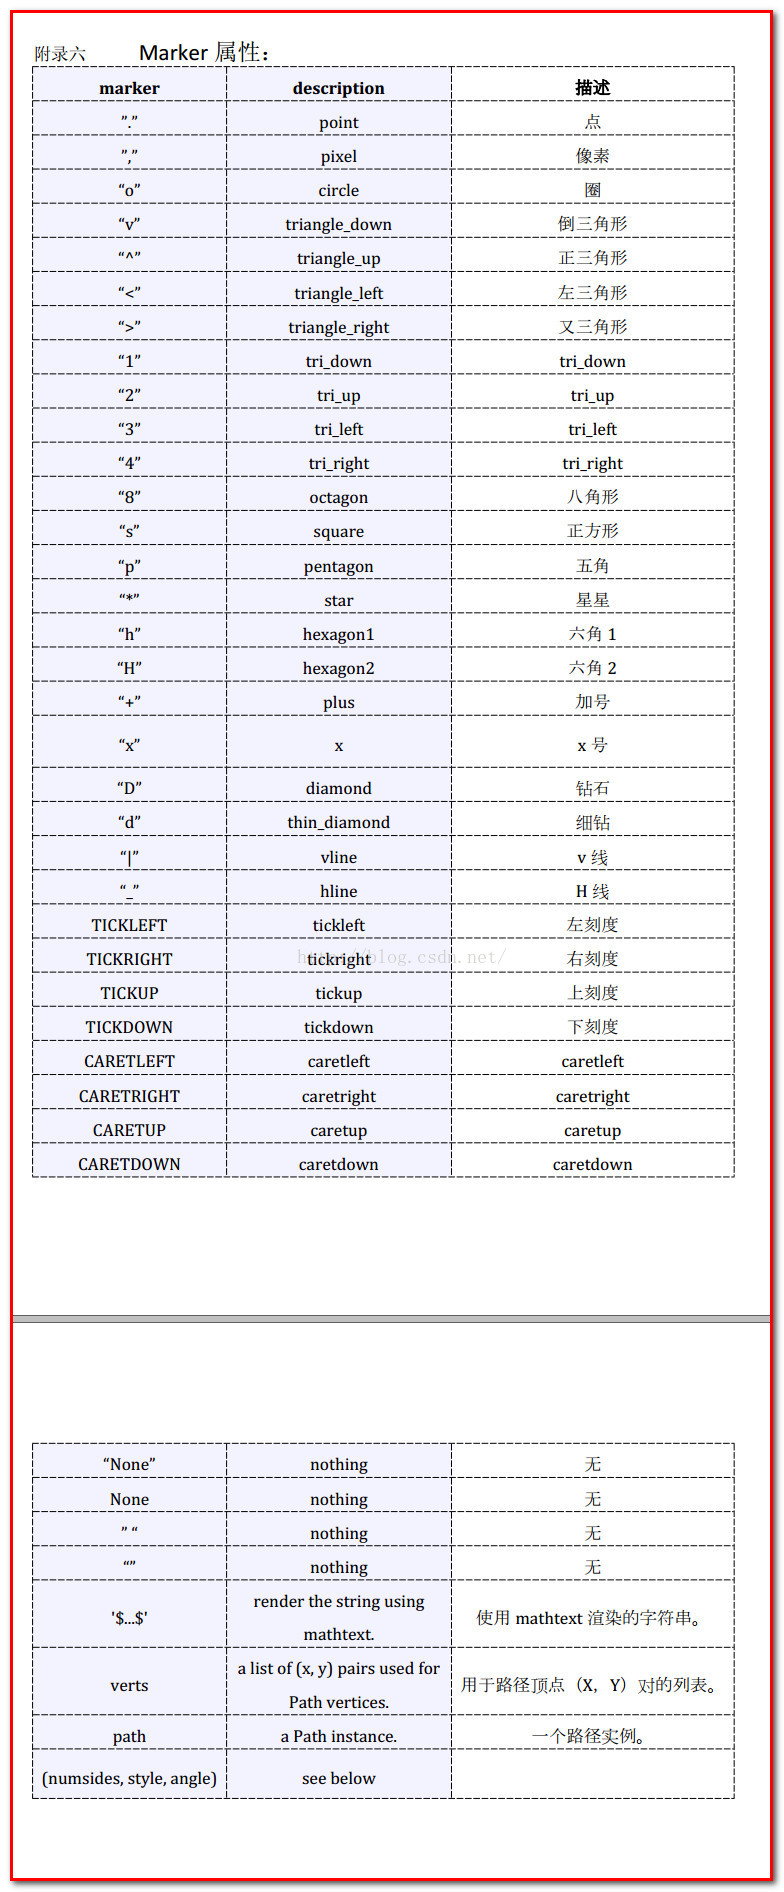
https://blog.csdn.net/weixin_40240670/article/details/80709573
颜色参数C的值:

2、自动计算
xV = list(np.arange(1, 5))
y = [x ** 2 for x in xV]
plit.scatter(xV, y,c=(0, 0.5, 0.3))
plit.show()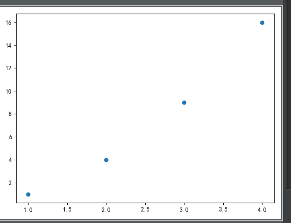
3、颜色映射
plt.scatter(x,y,c=y,cmap=plt.cm.gist_rainbow,s=20)#cm即colormap,c=y表示颜色随y变化
https://blog.csdn.net/Mr_Cat123/article/details/78638491
4、自动保存图表
xV = list(np.arange(1, 500))
y = [x ** 2 for x in xV]
plit.scatter(xV, y, c=y, cmap=plit.cm.hot, s=10)
# plit.show()
plit.savefig('aaa.png')  #图表保存,代替show
5、随机漫步
模拟随机
randomMy.py文件:
# 随机漫步

from random import choice

class RandomWalk():
    def __init__(self, num_points=50):
        self.num_points = num_points
        self.x_values = [0]
        self.y_values = [0]

    def fill_walk(self):
        while len(self.x_values) < self.num_points:
            x_direction = choice([1, -1])
            x_distance = choice([0, 1, 2, 3, 4])
            x_step = x_direction * x_distance

            y_direction = choice([1, -1])
            y_distance = choice([0, 1, 2, 3, 4])
            y_step = y_direction * y_distance

            if x_step == 0 and y_step == 0:
                continue

            next_x = self.x_values[-1] + x_step
            next_y = self.y_values[-1] + y_step

            self.x_values.append(next_x)
            self.y_values.append(next_y)
调用文件hello.py
# 随机漫步
from randomMy import RandomWalk
import matplotlib.pyplot as plit
rwn = RandomWalk()
rwn.fill_walk()
# plit.scatter(rwn.x_values, rwn.y_values, s=15) #点图1
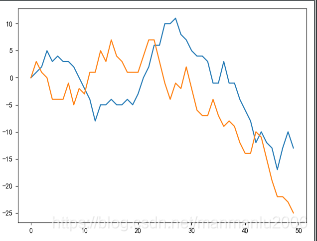
plit.plot(rwn.x_values) #线图2
plit.plot(rwn.y_values) #线图2
plit.show()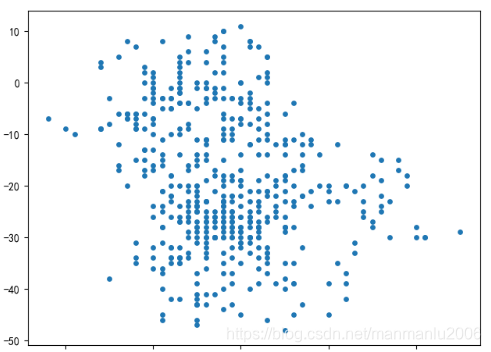
while True:
rwn = RandomWalk()
rwn.fill_walk()
point_number = list(range(rwn.num_points))
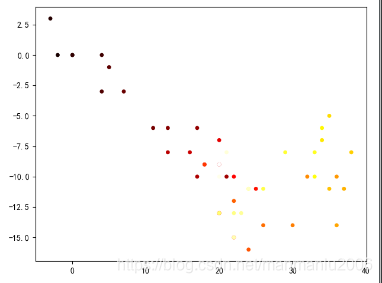
plit.scatter(rwn.x_values, rwn.y_values,c=point_number, cmap=plit.cm.hot, s=15)
    plit.scatter(0,0,c='green',edgecolors='none',s=100)   //图二   重新绘制原点、终点
    plit.scatter(rwn.x_values[-1],rwn.y_values[-1],c='red',edgecolors='none',s=100) //图二 重新绘制原点、终点

    plit.show()
    keep_running = input("make anoter walk?(y/n):")
 图一
图一 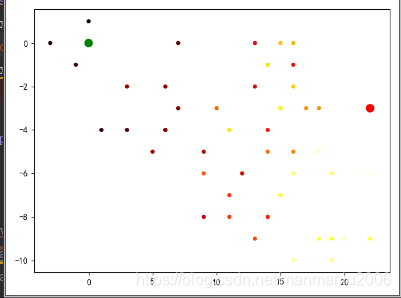 图二
图二
调整尺寸以适应屏幕
plit.figure(figsize=(10,6))
