调整坐标轴范围
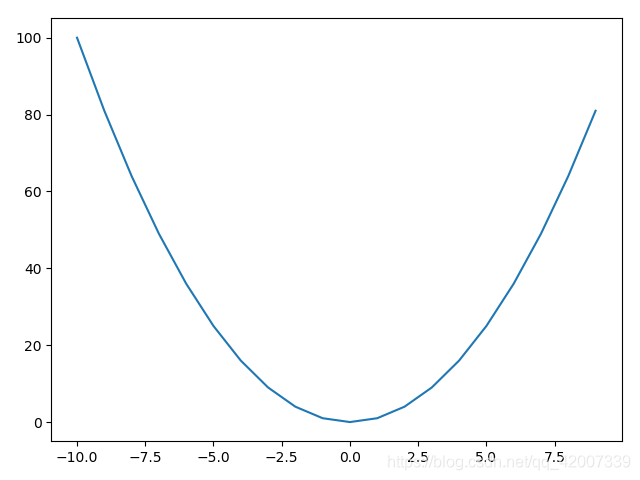
原图
import numpy as np
import matplotlib.pyplot as plt
x = np.arange(-10, 10)
plt.plot(x, x**2)

print(plt.axis())#输出坐标轴范围
(-10.95, 9.95, -5.0, 105.0)
plt.axis([-5, 5, 0, 80])#调整四个值
plt.xlim([-5, 5])#只调x轴
plt.ylim([0, 80])#只调y轴
plt.xlim(left=-5)#只调整x轴左侧