- plt
import numpy as np
import matplotlib.pyplot as plt

#plt
x = np.arange(2, 20)
y1 = x**2
y2 = np.log(x)
plt.plot(x, y1)
plt.twinx()#增加一个y坐标轴
plt.plot(x, y2)#新添加一条线
plt.show()
plt.plot(y1, x)
plt.twiny()#增加一个x坐标轴
plt.plot(y2, x, color='r')#新添加一条线
plt.show()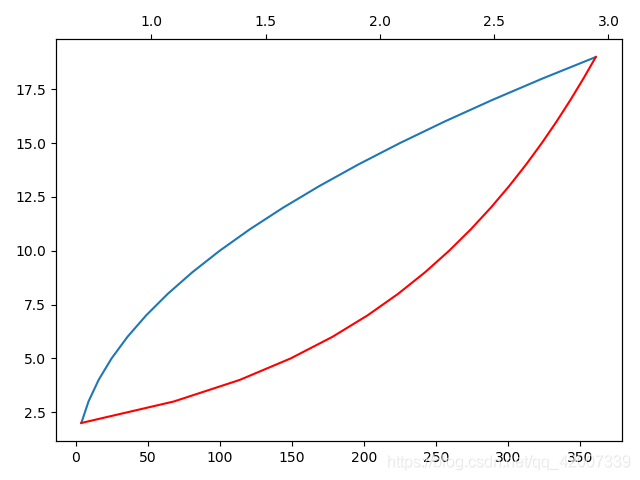
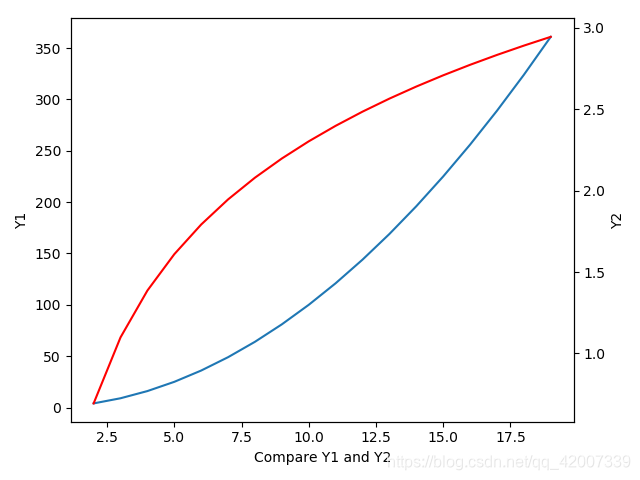
#面向对象
fig = plt.figure()
ax1 = fig.add_subplot(111)
ax1.plot(x, y1)
ax1.set_ylabel('Y1')
ax2 = ax1.twinx()
ax2.plot(x, y2, 'r')
ax2.set_ylabel('Y2')
ax1.set_xlabel('Compare Y1 and Y2')
plt.show()