将x轴或者y轴横移。
import matplotlib.pyplot as plt
import numpy as np
# 定义数据
x = np.linspace(-3, 3, 50)
y1 = 2*x + 1
y2 = x**2
# 定义figure
plt.figure()
# 绘图(x,y2)
plt.plot(x, y2)
# 绘图(x,y1)
plt.plot(x, y1, color='red', linewidth=1.0, linestyle='--')
# 设置坐标返回
plt.xlim((-1, 2))
plt.ylim((-2, 3))
# 设置x轴刻度 这里分为5个小刻度
new_ticks = np.linspace(-1, 2, 5)
print(new_ticks)
plt.xticks(new_ticks)
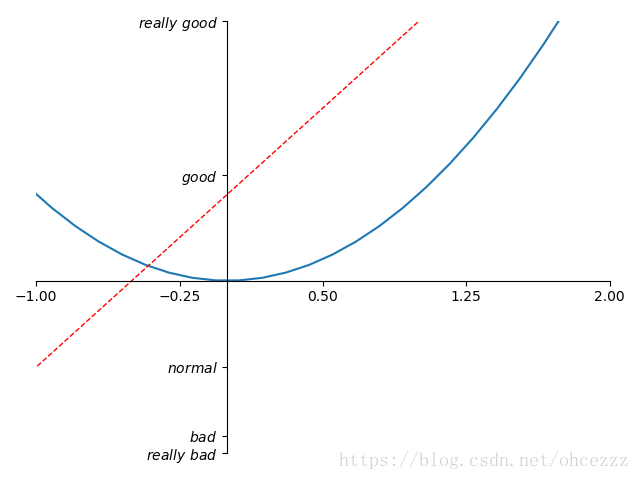
# 设置y轴刻度,这里将刻度以自定义的数字表示出来,比如-2显示为really bad
# 使用$来更好的匹配文本以及字体,$\pi$则会显示Pi
plt.yticks([-2, -1.8, -1, 1.22, 3],
[r'$really\ bad$', r'$bad$', r'$normal$', r'$good$', r'$really\ good$'])
# 得到坐标轴信息
ax = plt.gca()
# .spines设置边框;set_color设置颜色
# 将上方和右边的坐标线取消
ax.spines['right'].set_color('none')
ax.spines['top'].set_color('none')
# 设置x轴刻度位置,这里刻度在下方,
# 具体有[ 'top' | 'bottom' | 'both' | 'default' | 'none' ]
ax.xaxis.set_ticks_position('bottom')
# 设置边框位置,下方的边框位于y=0处,
# 具体有'outward' | 'axes' | 'data'
# axes: percentage of y axis
# data: depend on y data
ax.spines['bottom'].set_position(('data', 0))
# y轴刻度在左侧
# 具体有[ 'left' | 'right' | 'both' | 'default' | 'none' ]
ax.yaxis.set_ticks_position('left')
# 左侧边框在x=0处
ax.spines['left'].set_position(('data', 0))
plt.show()