axis()函数概述
axis()函数是一个坐标轴配置的方便接口。
axis()的函数签名为matplotlib.pyplot.axis(*args, emit=True, **kwargs)。
axis()的调用签名为:
xmin, xmax, ymin, ymax = axis()xmin, xmax, ymin, ymax = axis([xmin, xmax, ymin, ymax])xmin, xmax, ymin, ymax = axis(**kwargs)xmin, xmax, ymin, ymax = axis(option)
axis()的返回值是由xmin, xmax, ymin, ymax构成的元组,元素类型为浮点数,分别表示x,y轴坐标的极值。
axis()调用方式
axis()
不传递任何参数相当于坐标轴采用自动缩放(autoscale)方式,由matplotlib根据数据系列自动配置坐标轴范围和刻度。
axis([xmin, xmax, ymin, ymax])
传递一个由xmin, xmax, ymin, ymax构成的四元序列(列表、元组等)。
axis(**kwargs)
传递xmin, xmax, ymin, ymax等关键字参数。
案例:演示 axis([xmin, xmax, ymin, ymax])、axis(**kwargs)

import matplotlib.pyplot as plt

plt.figure(figsize=(13, 4))
plt.subplot(131)
plt.plot([1, 1])
# 演示axis()返回值
a = plt.axis()
plt.annotate(a, (0, 1))
plt.subplot(132)
plt.plot([1, 1])
# axis()接受一个4元序列
plt.axis([0, 1, 0.5, 1.5])
plt.subplot(133)
plt.plot([1, 1])
# xis()接受关键字参数,这里指定了3个,另外1个自动确定
plt.axis(xmin=0, xmax=1, ymin=0.5)
plt.show()
axis(option)
传递option字符串或布尔值,作用如下:
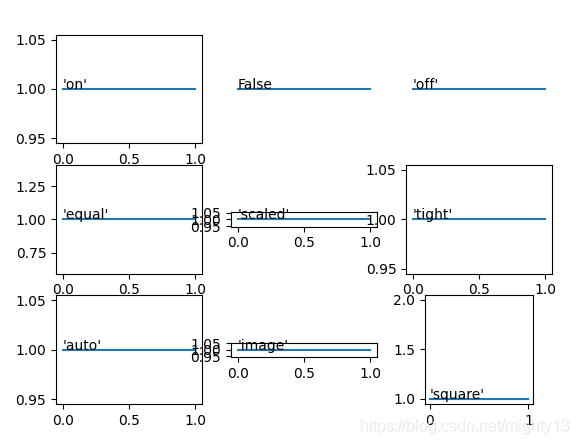
'on':显示坐标轴、坐标轴标签,等价于布尔值True。'off':不显示坐标轴、坐标轴标签,等价于布尔值False。注意Axes.set_frame_on只是不显示坐标轴,坐标轴标签仍然显示。'equal': 通过改变坐标轴极值等比例缩放, 相当于ax.set_aspect('equal', adjustable='datalim')。在这种情况下,明确设置坐标轴极值无效。'scaled':通过改变绘图区维度等比例缩放, 相当于ax.set_aspect('equal', adjustable='box', anchor='C'),不再进一步自动缩放坐标轴。'tight':仅修改坐标轴极值以显示全部数据,不再进一步自动缩放坐标轴。'auto':自动缩放坐标轴。'image':使用’scaled’ 模式,但是坐标轴极值等于数据极值。'square':设置绘图区为正方形,类似于'scaled',但是初始化时强制xmax-xmin == ymax-ymin。
案例:演示axis(option)
import matplotlib.pyplot as plt

plt.subplot(331)
# 'on'、'off'、True、False仅控制坐标轴、标签是否显示
# 坐标轴范围、刻度自动缩放。
plt.plot([1, 1])
plt.axis('on')
plt.annotate(repr('on'), (0, 1))
plt.subplot(332)
plt.plot([1, 1])
# 'on'相当于True,'off'相当于False
plt.axis(False)
plt.annotate('False', (0, 1))
plt.subplot(333)
plt.plot([1, 1])
plt.axis('off')
plt.annotate(repr('off'), (0, 1))
plt.subplot(334)
# 两坐标轴缩放比例一致,手动设置坐标轴范围无效
plt.plot([1, 1])
plt.axis([0, 1, 0, 5])
plt.axis('equal')
plt.annotate(repr('equal'), (0, 1))
plt.subplot(335)
# 两坐标轴缩放比例一致,坐标轴范围自动确定
plt.plot([1, 1])
plt.axis('scaled')
plt.annotate(repr('scaled'), (0, 1))
plt.subplot(336)
# 仅修改坐标轴极值
plt.plot([1, 1])
plt.axis('tight')
plt.annotate(repr('tight'), (0, 1))
plt.subplot(337)
# 自动缩放
plt.plot([1, 1])
plt.axis('auto')
plt.annotate(repr('auto'), (0, 1))
plt.subplot(338)
# 使用'scaled' 模式,但是坐标轴极值等于数据极值
plt.plot([1, 1])
plt.axis('image')
plt.annotate(repr('image'), (0, 1))
plt.subplot(339)
# 设置绘图区为正方形,类似于'scaled'
# 初始化时强制xmax-xmin == ymax-ymin
plt.plot([1, 1])
plt.axis([0, 1, 0, 5])
plt.axis('square')
plt.annotate(repr('square'), (0, 1))

plt.show()
原理
pyplot.axis()其实调用的是gca().axis(),即Aexs.axis()。
'on'、True调用Aexs.set_axis_on()'off'、False调用Aexs.set_axis_off()
底层相关函数有:
Aexs.set_axis_on()
Aexs.set_axis_off()
Aexs.set_autoscale_on()
Aexs.set_aspect()
Aexs.autoscale_view()
Aexs.get_xlim()
Aexs.set_xlim()
Aexs.get_ylim()
Aexs.set_ylim()
Aexs.axis()源码(matplotlib/Axes/_base.py)
def axis(self, *args, emit=True, **kwargs):

    if len(args) == 1 and isinstance(args[0], (str, bool)):
        s = args[0]
        if s is True:
            s = 'on'
        if s is False:
            s = 'off'
        s = s.lower()
        if s == 'on':
            self.set_axis_on()
        elif s == 'off':
            self.set_axis_off()
        elif s in ('equal', 'tight', 'scaled', 'auto', 'image', 'square'):
            self.set_autoscale_on(True)
            self.set_aspect('auto')
            self.autoscale_view(tight=False)
            # self.apply_aspect()
            if s == 'equal':
                self.set_aspect('equal', adjustable='datalim')
            elif s == 'scaled':
                self.set_aspect('equal', adjustable='box', anchor='C')
                self.set_autoscale_on(False)  # Req. by Mark Bakker
            elif s == 'tight':
                self.autoscale_view(tight=True)
                self.set_autoscale_on(False)
            elif s == 'image':
                self.autoscale_view(tight=True)
                self.set_autoscale_on(False)
                self.set_aspect('equal', adjustable='box', anchor='C')
            elif s == 'square':
                self.set_aspect('equal', adjustable='box', anchor='C')
                self.set_autoscale_on(False)
                xlim = self.get_xlim()
                ylim = self.get_ylim()
                edge_size = max(np.diff(xlim), np.diff(ylim))[0]
                self.set_xlim([xlim[0], xlim[0] + edge_size],
                              emit=emit, auto=False)
                self.set_ylim([ylim[0], ylim[0] + edge_size],
                              emit=emit, auto=False)
        else:
            raise ValueError('Unrecognized string %s to axis; '
                             'try on or off' % s)
    else:
        if len(args) >= 1:
            if len(args) != 1:
                cbook.warn_deprecated(
                    "3.2", message="Passing more than one positional "
                    "argument to axis() is deprecated and will raise a "
                    "TypeError %(removal)s.")
            limits = args[0]
            try:
                xmin, xmax, ymin, ymax = limits
            except (TypeError, ValueError) as err:
                raise TypeError('the first argument to axis() must be an '
                                'interable of the form '
                                '[xmin, xmax, ymin, ymax]') from err
        else:
            xmin = kwargs.pop('xmin', None)
            xmax = kwargs.pop('xmax', None)
            ymin = kwargs.pop('ymin', None)
            ymax = kwargs.pop('ymax', None)
        xauto = (None  # Keep autoscale state as is.
                 if xmin is None and xmax is None
                 else False)  # Turn off autoscale.
        yauto = (None
                 if ymin is None and ymax is None
                 else False)
        self.set_xlim(xmin, xmax, emit=emit, auto=xauto)
        self.set_ylim(ymin, ymax, emit=emit, auto=yauto)
    if kwargs:
        raise TypeError(f"axis() got an unexpected keyword argument "
                        f"'{next(iter(kwargs))}'")
    return (*self.get_xlim(), *self.get_ylim())