摘要
本文介绍了最基础的回归问题——多元线性回归,并通过python进行实现及可视化展示运行结果。
线性回归简介
线性回归问题的重点在于如何求解回归函数的截距和系数。
1、构建代价函数(也叫损失函数):平均平方误差。
2、通过最小二乘法或其他优化算法进行求解,因为线性回归的代价函数为凸函数,所以一般的经典优化算法用于求解都是适用的,如梯度下降法、单纯形法等等。
python实现
CyrusLinearRegression类的有如下方法和属性:
1、fit():用于拟合模型。
2、predict():用于模型预测
3、coef:回归函数的系数
4、intercept:回归函数的截距
from sympy import *
import numpy as np
import matplotlib.pyplot as plt
from matplotlib import font_manager
ft = font_manager.FontProperties(fname = "C:\Windows\Fonts\simsun.ttc") # 设置matplotlib的中文显示字体
class CyrusLinearRegression(object):
def __init__(self):
self.x = None
self.y = None
self.coef = None
self.intercept = None
# 自定义回归函数形式
def regression_func(self,x):
func_ = Symbol("a0")
func = []
for i in range(self.x.shape[1]):
func.append(Symbol("a"+str(i+1)))
return (Matrix(func).transpose() * Matrix(x) + Matrix([func_]))[0]
# 计算损失函数
def cal_loss_function(self):
loss_func = 0
for i in range(self.x.shape[0]):
loss_func += (self.regression_func(self.x[i,:]) - self.y[i,0])**2
return loss_func/(2*int(self.x.shape[0]))
# 定义损失函数
def loss_function(self,a):
loss_func = self.cal_loss_function()
for i in range(self.x.shape[1]+1):
temp_sym = Symbol("a"+str(i))
loss_func = loss_func.subs(temp_sym,a[i])
return loss_func
def fit(self,x,y):
# 1、初始化赋值
self.x = np.array(x)
self.y = np.array(y).reshape(-1,1)
# 2、采用nelder-mead(单纯形)优化算法最小化损失函数
loss_func = self.loss_function
from scipy.optimize import minimize
a = minimize(loss_func, [0 for i in range(self.x.shape[1]+1)], method='nelder-mead',options={'xatol': 1e-8, 'disp': True})
result = a.x
self.coef = result[1:]
self.intercept = result[0]
def predict(self,x):
x = np.array(x)
y = []
for i in range(x.shape[0]):
value = self.intercept
for index,item in enumerate(self.coef):
value += x[i,index]*item
y.append(value)
return np.array(y).reshape(-1,1)
if __name__ == "__main__":
x = np.random.randint(1,100,60).reshape(20,3)
y = np.array([5*x[i,0]-3*x[i,0]+3.5*x[i,0]-3+np.random.randn(1) for i in range(x.shape[0])]).reshape(-1,1)
lr_model = CyrusLinearRegression()
lr_model.fit(x,y)
# 打印结果
print("*"*10,'LinearRegression',"*"*10)
print('coef:',lr_model.coef)
print('intercept:',lr_model.intercept)
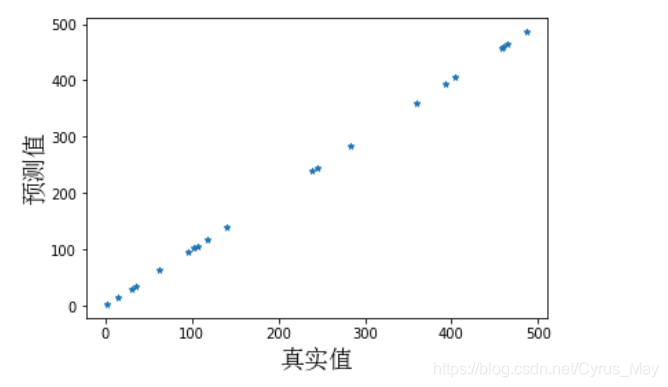
# 模型预测并与真实值
y_predict = lr_model.predict(x)
fig = plt.figure()
fig.add_subplot(111)
plt.scatter(y_predict,y,marker = "*",s = 18)
plt.xlabel("真实值",fontproperties = ft,size = 18)
plt.ylabel("预测值",fontproperties = ft,size = 18)
运行结果及可视化
********** LinearRegression **********
coef: [ 5.50424056  0.00784916 -0.00707917]
intercept: -3.1227798356667718
by CyrusMay 2020 05 08
天雨粟
鬼夜哭
思念漫太古
——五月天(仓颉)——