本篇blog只是实现去雾与加雾最简单的方法,还有很多高级的,自动的方法,比如CLAHE (对比度有限的自适应直方图均衡)。Q1使用了一个小trick (直方图上累计更新)实现直方图均衡化达到增强图像对比度的目的,Q2先加入一些均匀白噪声,再用高斯滤波器去模糊化,实现提高大像素值的占比,直方图居中化的目的。
Q1: 实现图像去雾的效果 (提高图像质量),如下:

Solution:
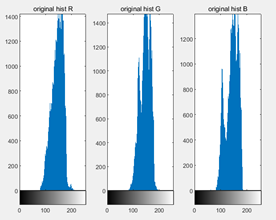
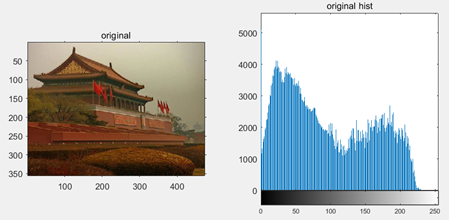
- Observations:
The three-channel histograms of the original foggy image:
Realize the histogram equalization for the image to improve the contrast degree.
- Algorithm:
Basic idea: Because the histograms of the three channels are similar, so considering all pixels together. Making all pixels as a list, then calculating all pixel-values frequency (probability) first. Notice that Most values are center in the middle, so we can make accumulated frequency to replace original frequency, which will fill the right-part frequencies. Now, the whole figure is brighter, so we can use a Gamma Transform to make it a little darker. The Gamma Transform formula is 255*(pix/255)^(γ).
The pipeline as follows:

- Result:
The result of the third step in the flow graph:
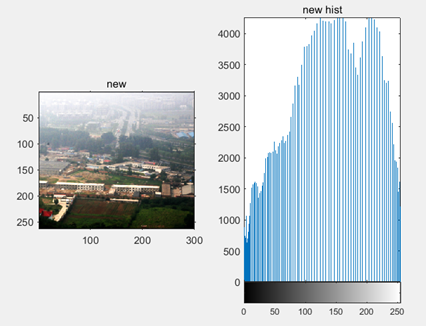
The final result:

- Code:
clc; clear all; close all;
addpath('./question1_images/');
fig1=imread('Ex_ColorEnhance.png');
figure;
subplot(1,2,1);imshow(fig1);title('original');
subplot(1,2,2);imhist(fig1);title('original hist');

[row,col,channel]=size(fig1);
max_pix=255;
% calculate pixels frequency
mtx=fig1(:);
mtx_freq=zeros(1,256);
for i=1:length(mtx)
   mtx_freq(mtx(i)+1) = mtx_freq(mtx(i)+1)+1;
end
mtx_freq=mtx_freq/length(mtx);
% calculate sum
mtx_sum=zeros(1,256);
mtx_sum(1)=mtx_freq(1);
for j=2:256
    mtx_sum(j)=mtx_sum(j-1)+mtx_freq(j);
end
% get new fig
result1=fig1;
for k=1:channel
    for i=1:row
        for j=1:col
%             result1(i,j,k)=mtx_sum(fig1(i,j,k)+1)*max_pix; % no Gamma correction
            result1(i,j,k)=power(mtx_sum(fig1(i,j,k)+1),1.4)*max_pix; %
%             add Gamma correction, gamma=1.4
        end
    end
end
% show new fig
result1=uint8(result1);
figure;
subplot(1,2,1);imshow(result1);title('new');
subplot(1,2,2);imhist(result1);title('new hist');
Q2: 实现图像加雾的效果 (损害图像质量):
Solution:
- Observations:

After observing the histogram of the original figure, if blur it, we need to concentrate the histogram.
- Algorithm:
(1) Add the same-value white noise uniformly every other pixel on the figure.
(2) Run Gaussian filter on the whole figure twice, the kernel size is 3x3, and no padding.
- Results:
Before:
After:

- Code:
clc; clear all; close all;
addpath('./question1_images/');
fig2=imread('Tam_clear.jpg');
figure;
subplot(1,2,1);imshow(fig2);title('original');
subplot(1,2,2);imhist(fig2);title('original hist');
result2=fig2;
[row,col,channel] = size(fig2);
% add white noise
for k = 1:channel
 for i = 1:row
    for j = 1:col
        if mod(i,2)==0 && mod(j,2)==0
            result2(i,j,k) = 150; % add the same-value white noise uniformly every other pixel
        end
    end
 end
end
% add a Gaussian filter to blur the figure
result2=double(result2);
Gaussian_filter=1/16*[1 2 1; 2 4 2; 1 2 1];

for times=1:2 % twice
   for k=1:channel
        for i=2:(row-1)
            for j=2:(col-1)
                result2(i,j,k)=sum(sum(result2(i-1:i+1,j-1:j+1,k).*Gaussian_filter));
            end
        end
    end
end
result2=uint8(result2);
figure;
subplot(1,2,1);imshow(result2);title('foggy');
subplot(1,2,2);imhist(result2);title('foggy hist');