文章目录
随机漫步
随机漫步:每次行走都是完全随机的、没有明确的方向,结果是由一系列随机决策决定的。你可以将随机漫步看作蚂蚁在晕头转向的情况下,每次都沿随机的方向前行所经过的路径。
1.1 创建RandomWalk类
为模拟随机漫步,将创建一个名为RandomWalk 的类,它随机地选择前进方向。这个类需要三个属性:
- 一个是存储随机漫步次数的变量,
- 其他两个是列表,分别存储随机漫步经过的每个点的 坐标和 坐标。
RandomWalk 类只包含两个方法:方法__init___() 和fill_walk() ,后者计算随机漫步经过的所有点。
方法__init___() 如下所示:
from random import choice
class RandomWalk:
    def __init__(self,num_points = 5000):
        self.num_points = num_points
        self.x_values = [0]
        self.y_values = [0]
使用random模块中的choice来生成随机数,将随机漫步的默认点个数设置为5000,。x_value 和 y_values用来储存x值和y值的列表,让每次漫步都从(0,0)点出发。
1.2 选择方向
定义fill_walk方法生成每次漫步的坐标点并且确定每次漫步的方向。
    def fill_walk(self):
        while len(self.x_values) < self.num_points:
            x_direction = choice([1, -1])
            x_distance = choice([0, 1, 2, 3, 4])
            x_step = x_direction * x_distance

            y_direction = choice(1, -1)
            y_distance = choice([0, 1, 2, 3, 4])
            y_step = y_direction * y_distance

            ##拒绝原地踏步
            if x_step == 0 and y_step == 0:
                continue

            x = self.x_values[-1] + x_step
            y = self.y_values[-1] + y_step

            self.x_values.append(x)
            self.y_values.append(y)
- x/y_direction : 从-1和1里随机选择方向,1代表向右走,-1代表向左走。
- x/y_distance:随机选择0-4的整数,告诉python沿指定方向走多远。
- x/y_step:确定沿轴移动的距离和方向。
- x/y:代表当前所在的坐标位置,然后添加到列表的末尾,方便进行下一次操作。
random_walk.py:
from random import choice

class RandomWalk:
    def __init__(self, num_points=5000):
        self.num_points = num_points
        self.x_values = [0]
        self.y_values = [0]

    def fill_walk(self):
        while len(self.x_values) < self.num_points:
            x_direction = choice([1, -1])
            x_distance = choice([0, 1, 2, 3, 4])
            x_step = x_direction * x_distance

            y_direction = choice([1, -1])
            y_distance = choice([0, 1, 2, 3, 4])
            y_step = y_direction * y_distance

            ##拒绝原地踏步
            if x_step == 0 and y_step == 0:
                continue

            x = self.x_values[-1] + x_step
            y = self.y_values[-1] + y_step

            self.x_values.append(x)
            self.y_values.append(y)
1.3 绘制随机漫步图
main.py:
import matplotlib.pyplot as plt
from random_walk import RandomWalk
rw = RandomWalk()
rw.fill_walk()
plt.style.use('classic')
fig,ax = plt.subplots()
ax.set_title("Random Walk")
ax.set_xlabel('x')
ax.set_ylabel('y')
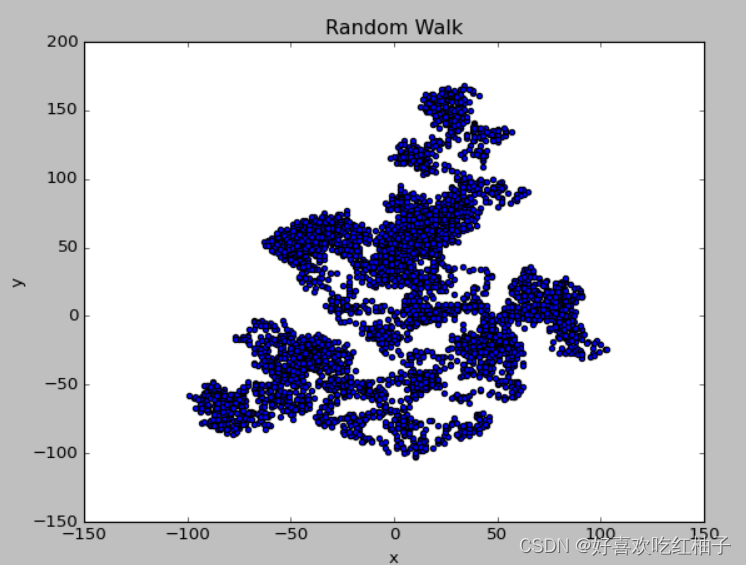
ax.scatter(rw.x_values,rw.y_values,s=15)
plt.show()
生成了随机漫步的散点图。
1.4 模拟多次随机漫步
使用while循环进行多次散点图的绘制。
import matplotlib.pyplot as plt
from random_walk import RandomWalk

while True:
    rw = RandomWalk()
    rw.fill_walk()

    plt.style.use('classic')
    fig, ax = plt.subplots()
    ax.set_title("Random Walk")
    ax.set_xlabel('x')
    ax.set_ylabel('y')
    ax.scatter(rw.x_values, rw.y_values, s=15)
    plt.show()

    keep_running = input('Do you wanna make another walk?(y/n) ')
    if keep_running == 'n':
        break
1.5 设置随机漫步图样式
1.5.1 给点着色
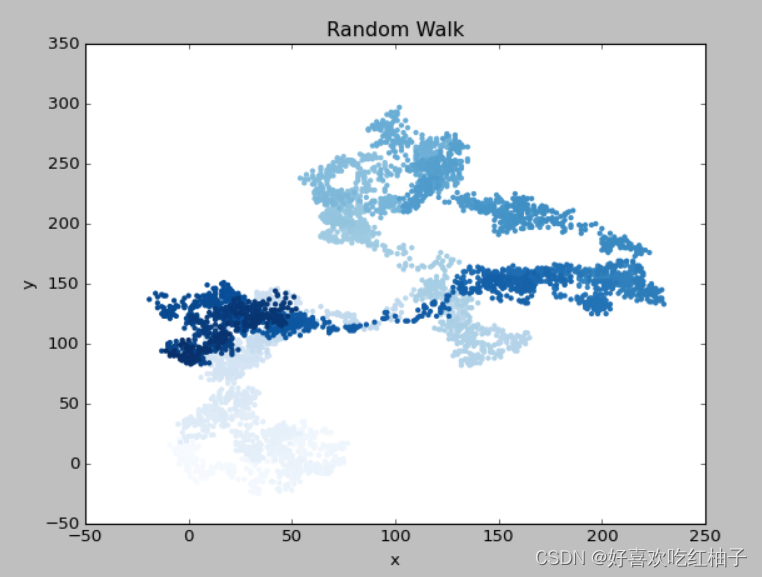
使用颜色映射来指出漫步中各点的先后顺序,并且删除每个点的边缘轮廓色,让颜色更加明显。
- 参数c:一共5000个点,故c的赋值为0-4999,可以使用range生成。
- cmap:指定映射颜色为 plt.cm.Blues
- edgecolors:每个点边缘轮廓色,设置为’none’。
import matplotlib.pyplot as plt
from random_walk import RandomWalk

while True:
    rw = RandomWalk()
    rw.fill_walk()

    plt.style.use('classic')
    fig, ax = plt.subplots()
    ax.set_title("Random Walk")
    ax.set_xlabel('x')
    ax.set_ylabel('y')
    point_number = range(rw.num_points)
    ax.scatter(rw.x_values, rw.y_values,c = point_number,cmap = plt.cm.Blues, s=15)
    plt.show()

    keep_running = input('Do you wanna make another walk?(y/n) ')
    if keep_running == 'n':
        break
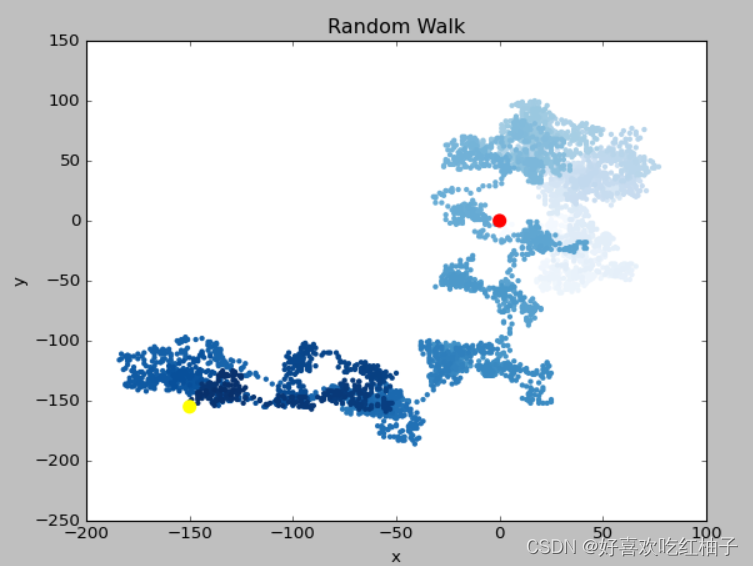
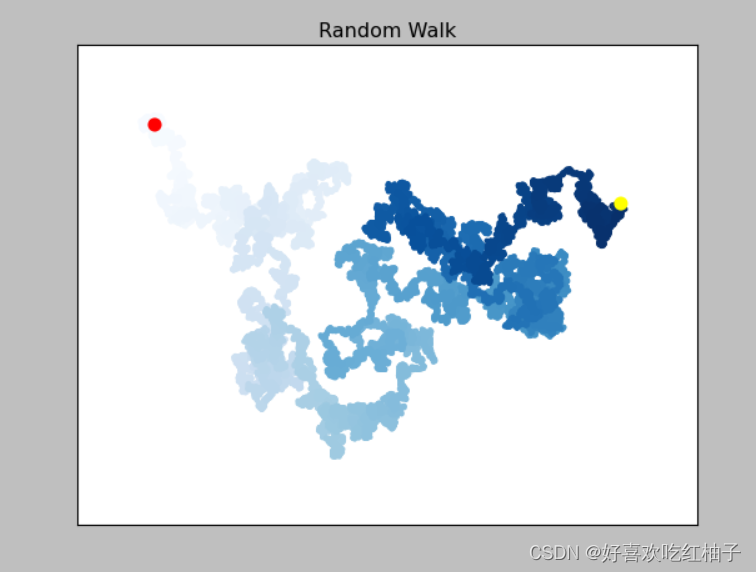
1.5.2 重新绘制起点和终点
让起点和终点更大并且显示为不同的颜色。
- 让起点为红色,终点为黄色。
ax.scatter(0,0,c='red',edgecolors='none',s=100)
ax.scatter(rw.x_values[-1],rw.y_values[-1],c='yellow',edgecolors='none',s=100)
完整代码如下:
ax.scatter(0,0,c='red',edgecolors='none',s=100)
ax.scatter(rw.x_values[-1],rw.y_values[-1],c='yellow',edgecolors='none',s=100)
1.5.3 隐藏坐标轴
ax.get_xaxis().set_visible(False)
ax.get_yaxis().set_visible(False)
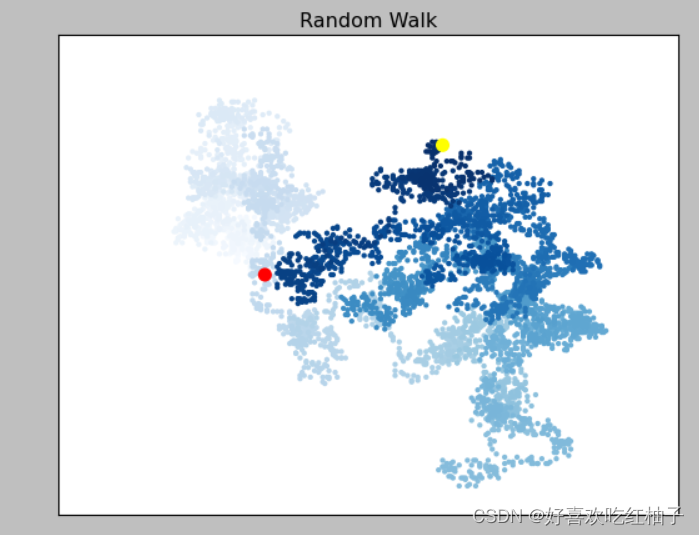
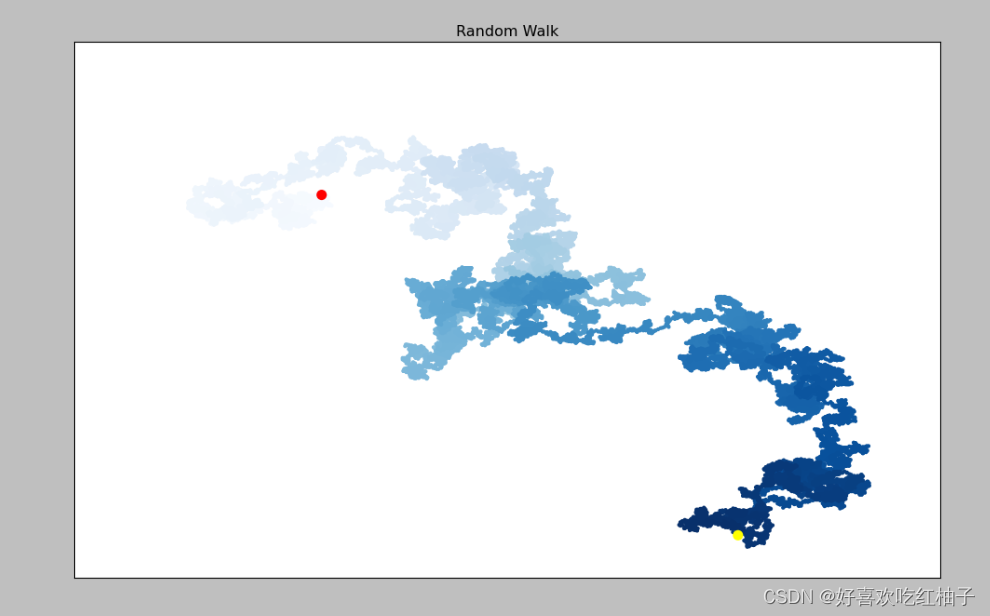
1.5.4 增加点数
在类中传入想要绘制的点个数。
rw = RandomWalk(50000)
1.5.5 调整图片尺寸以适应屏幕
图表适合屏幕大小时,更能有效地将数据中的规律呈现出来。为让绘图窗口更适合屏幕大小。
- 创建图表时,可传递参数figsize以指定生成的图形的尺寸。需要给参数figsize 指定一个元组,向Matplotlib指出绘图窗口的尺寸,单位为英寸。
fig, ax = plt.subplots(figsize = (15,9))
附录(项目代码)
random_walk.py 完整代码
from random import choice

class RandomWalk:
    def __init__(self, num_points=5000):
        self.num_points = num_points
        self.x_values = [0]
        self.y_values = [0]

    def fill_walk(self):
        while len(self.x_values) < self.num_points:
            x_direction = choice([1, -1])
            x_distance = choice([0, 1, 2, 3, 4])
            x_step = x_direction * x_distance

            y_direction = choice([1, -1])
            y_distance = choice([0, 1, 2, 3, 4])
            y_step = y_direction * y_distance

            ##拒绝原地踏步
            if x_step == 0 and y_step == 0:
                continue

            x = self.x_values[-1] + x_step
            y = self.y_values[-1] + y_step

            self.x_values.append(x)
            self.y_values.append(y)
main.py 完整代码
import matplotlib.pyplot as plt
from random_walk import RandomWalk

while True:
    rw = RandomWalk(50000)
    rw.fill_walk()

    plt.style.use('classic')
    fig, ax = plt.subplots(figsize = (15,9))
    ax.set_title("Random Walk")
    ax.set_xlabel('x')
    ax.set_ylabel('y')
    point_number = range(rw.num_points)
    ax.scatter(rw.x_values, rw.y_values,c = point_number,cmap = plt.cm.Blues,edgecolors='none', s=15)
# 起点和终点的颜色设置
    ax.scatter(0,0,c='red',edgecolors='none',s=100)
    ax.scatter(rw.x_values[-1],rw.y_values[-1],c='yellow',edgecolors='none',s=100)
# 隐藏坐标轴
    ax.get_xaxis().set_visible(False)
    ax.get_yaxis().set_visible(False)

    plt.show()

    keep_running = input('Do you wanna make another walk?(y/n) ')
    if keep_running == 'n':
        break