
本文介绍的是使用arduino驱动超声波测量距离,并通过串口将数据发送给python,从而进行数据处理,处理结果如图所示。
准备工作
超声波模块+arduino开发板+杜邦线数根+python开发环境
思路
首先使用arduino车辆距离,通过串口将数据发送给python代码进行数据处理并绘制成图像进行实时显示。
超声波模块介绍
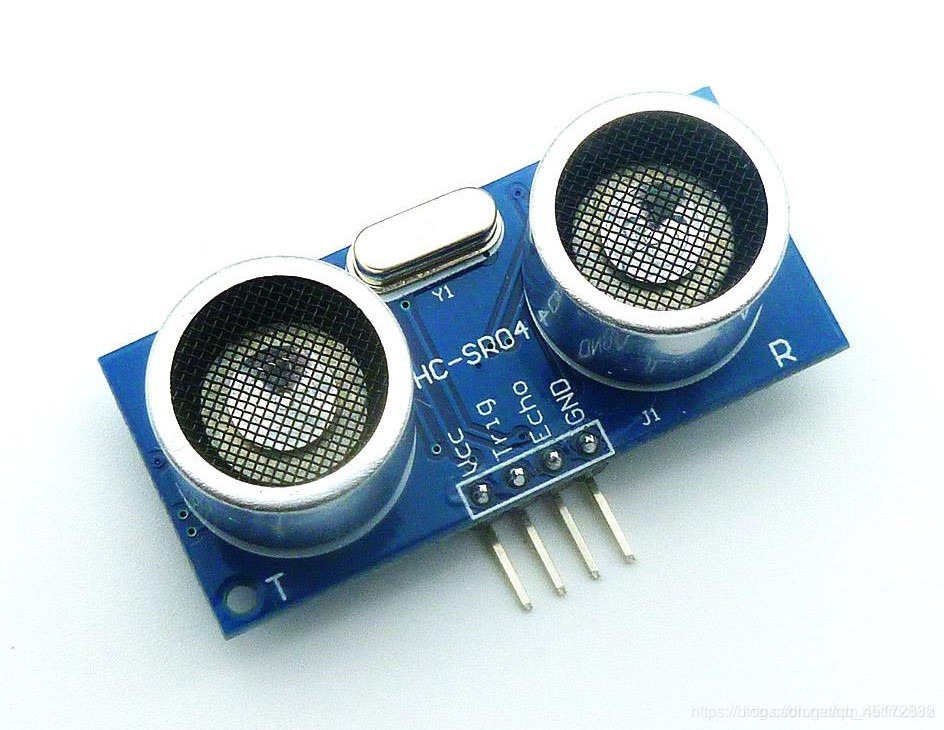
如上图所示,VCC 供5V电源, GND 为地线,TRIG 触发控制信号输入,ECHO 回响信号输出等四个接口端。
2、电路连接
接线比较简单,按照如下顺序连线即可:
3、程序编写
根据模块的原理来进行代码编写,超声测距时的操作时序如下: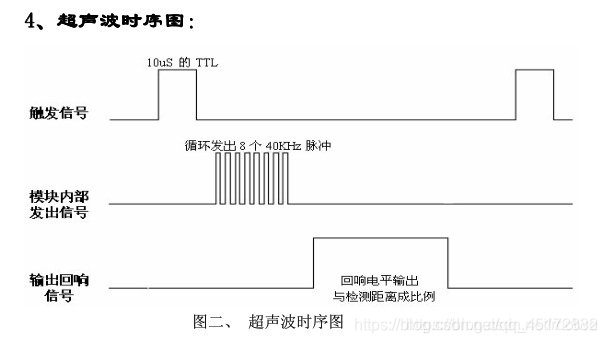
以上时序图表明你只需要提供一个 10uS 以上脉冲触发信号,该模块内部将发出 8 个 40kHz 周期电平并检测回波。一旦检测到有
回波信号则输出回响信号。回响信号的脉冲宽度与所测的距离成正比。由此通过发射信号到收到的回响信号时间间隔可以计算得
到距离。公式:uS/58=厘米或者 uS/148=英寸;或是:距离=高电平时间*声速(340M/S)/2;建议测量周期为 60ms 以上,以
防止发射信号对回响信号的影响。
注意:
1、此模块不宜带电连接,若要带电连接,则先让模块的 GND 端先连接,否则会影响模块的正常工作。
2、测距时,被测物体的面积不少于 0.5 平方米且平面尽量要求平整,否则影响测量的结果。
编写代码如下:
/**
*    文件: 超声测距.ino      by 零知实验室([url=http://www.lingzhilab.com]www.lingzhilab.com[/url])
*    -^^- 零知开源,让电子制作变得更简单! -^^-
**/


#define SR04_TRIG        9
#define SR04_ECHO        10

// the setup routine runs once when you press reset:
void setup() {
    // put your setup code here, to run once:

        pinMode(SR04_TRIG, OUTPUT);
        pinMode(SR04_ECHO, INPUT);

        Serial.begin(9600);
}

// the loop routine runs over and over again forever:
void loop() {
    // put your main code here, to run repeatedly:

        int distance = getDistance();

        Serial.print("distance = ");
        Serial.println(distance);

        delay(300);
}
serial库的安装
安装 pip install serial。下载了一会安装好了,再运行,还是提示同样的错误。上网查了一下,应该安装 pip install pyserial。
如果上述方法安装失败,可能需要下载下来再安装。
在 https://pypi.org/project/pyserial/#files 中,有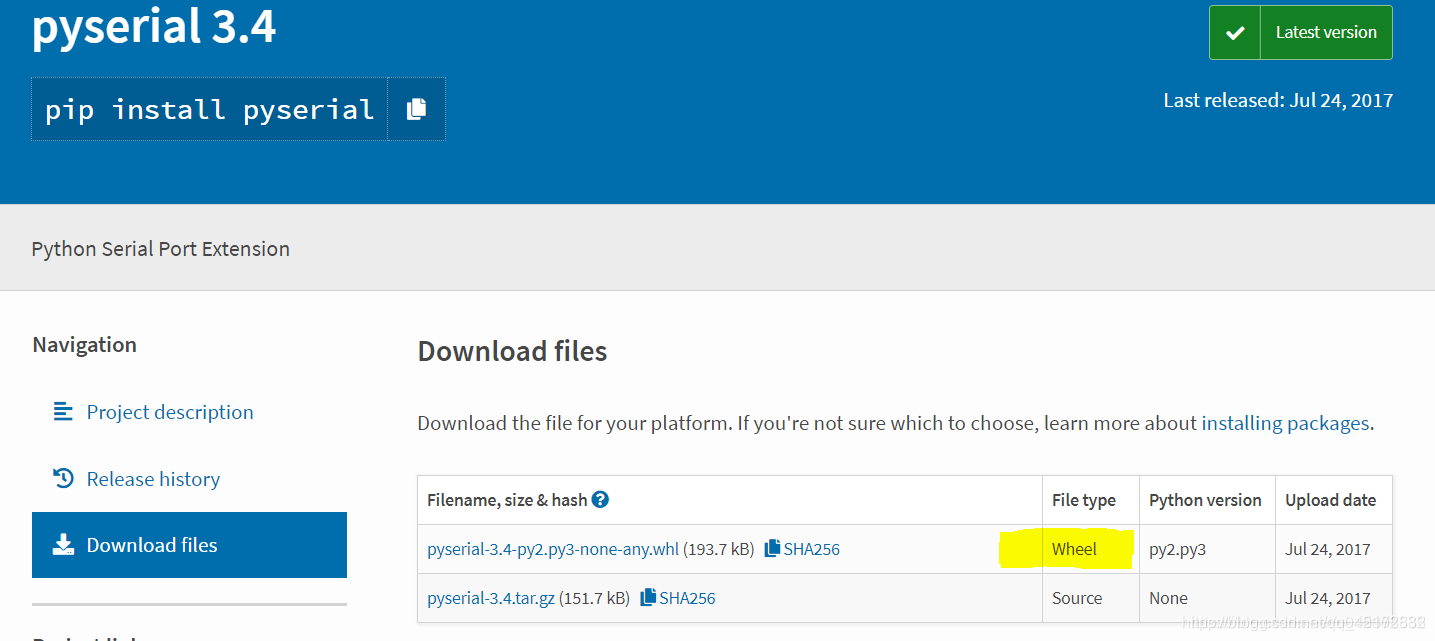
Windows下下载这个wheel格式的文件。关于wheel文件
如果你已经安装了pip,那么你需要把它升级到最新版本。
以管理员身份运行cmd
转到Python安装目录的Scripts目录下:
cd C:\Program Files\Python36\Scripts
pip install wheel
pip install 路径\文件名.whl:
pip install C:\Users\0AQZ0\Downloads\matplotlib-2.1.2-cp27-cp27m-win_amd64.whl
以上经验来源于:EmbededDriver的博客https://blog.csdn.net/u012308586/article/details/89449004
matplotlib库的安装
一、一般方法
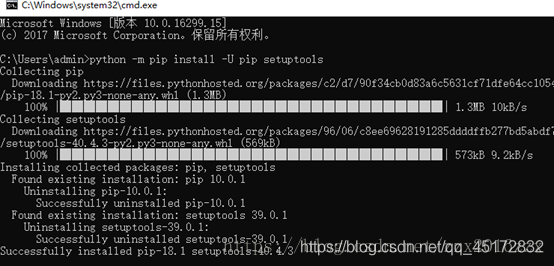
1.Win+R输入cmd进入到CMD窗口下,执行python -m pip install -U pip setuptools进行升级。
2.输入python -m pip install matplotlib进行自动的安装,系统会自动下载安装包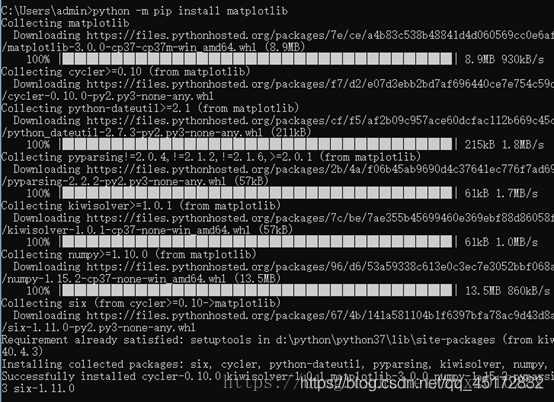
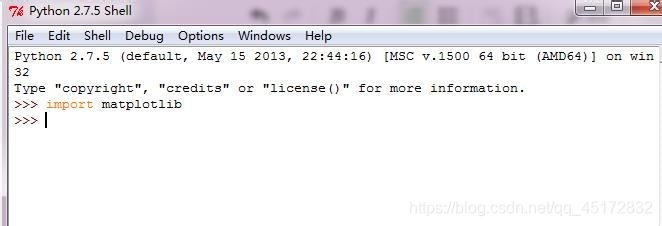
3.进入到python idle中,运行import matplotlib,如下图所示,如果没有报错,就证明安装成果。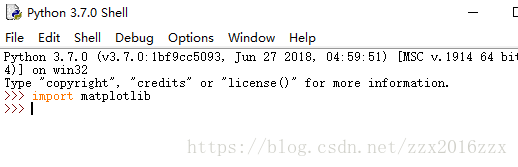
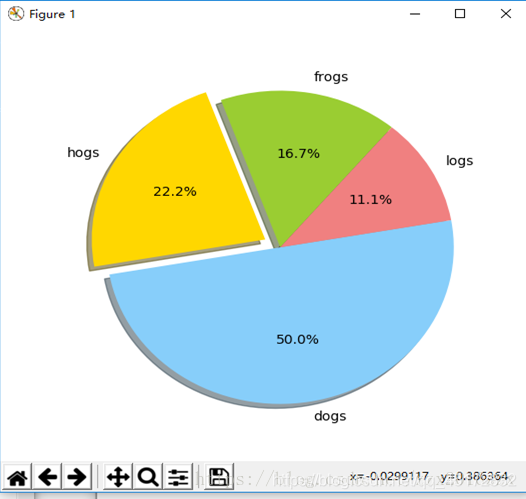
输入以下代码运行成果证明安装没问题
import matplotlib.pyplot as plt
labels='frogs','hogs','dogs','logs'
sizes=15,20,45,10
colors='yellowgreen','gold','lightskyblue','lightcoral'
explode=0,0.1,0,0
plt.pie(sizes,explode=explode,labels=labels,colors=colors,autopct='%1.1f%%',shadow=True,startangle=50)
plt.axis('equal')
plt.show()
以上方法来源于:猪猪侠喜欢躲猫猫的博客:最简单的matplotlib安装教程
二、特殊方法
我建议大家用exe文件安装matplotlib,我使用setuptools安装,没安装成功,提示一堆错误。所以我推荐还是exe安装,我把matplotlib的exe安装文件列表写在下面的参考资料里。你找到对应版本的下载就可以,这里是安装过程:
1、首先,我们下载了适合自己的版本

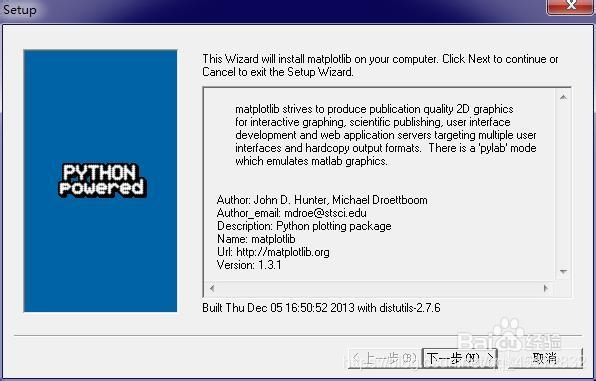
2、打开它,就会看到安装界面,点击下一步
3、这里,输入python的安装目录,点击下一步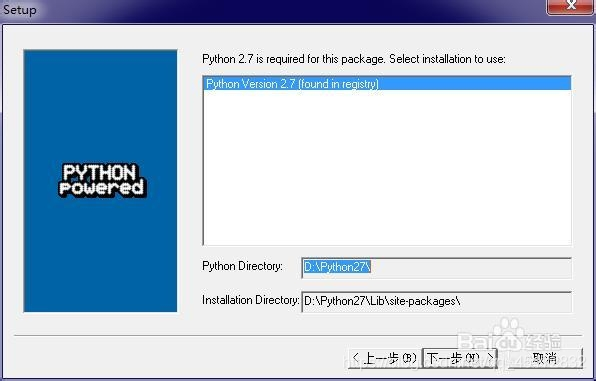
4、安装过程的截图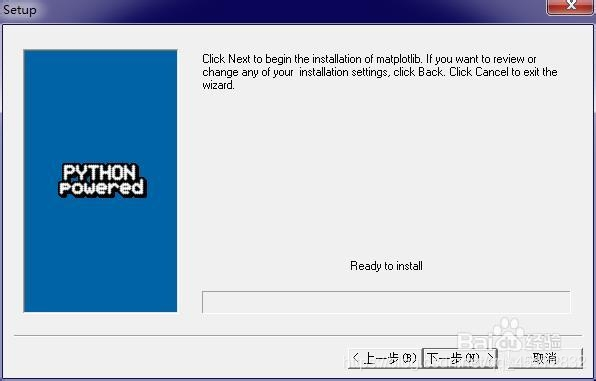
5、现在就安装好了,引入一下,看看是否出现了错误,没有错误就说明安装成功。
错误参考:
如果提示错误:ImportError: matplotlib requires dateutil,你可以看这篇文章:http://jingyan.baidu.com/article/aa6a2c14d5aa7f0d4c19c4e2.html
如果提示错误:ImportError: matplotlib requires
pyparsing,你可以看这篇文章:http://jingyan.baidu.com/article/e4d08ffdd3b9690fd2f60de2.html
以上经验来源于百度经验:Python教程:[55]matplotlib安装下载方法https://jingyan.baidu.com/article/154b46315523b428ca8f41e2.html
python读取串口数据代码
import serial

ser=serial.Serial("COM3",115200,timeout=0.5)	#打开串口

while (1):
	ch=ser.read()
	str1=ch.decode("iso-8859-15")	#bytes转str

	if(str1):	#判断数据是否为空,很重要
		l=ord(str1)		#str转int,方便数据计算和处理
		print("%x" % l)

	pass
python进行图像绘制的程序代码
import matplotlib.pyplot as plt

ax = []                    # 定义一个 x 轴的空列表用来接收动态的数据
ay = []                    # 定义一个 y 轴的空列表用来接收动态的数据
plt.ion()                  # 开启一个画图的窗口
i=1
while i<1000:
	#print(b)
	if b == "":
		b = 0
		#print(b)
	else:
		b = float(b)
		#print(b)

		ax.append(i)           # 添加 i 到 x 轴的数据中
		i=i+1
		ay.append(b)        # 添加 i 的平方到 y 轴的数据中
		plt.clf()             		 # 清除之前画的图
		plt.plot(ax,ay)        # 画出当前 ax 列表和 ay 列表中的值的图形
		plt.pause(0.1)         # 暂停一秒
		plt.ioff()             # 关闭画图的窗口
绘制的图像如下图
整体代码
arduino代码:
int TrgPin = A0;
int EcoPin = A1;
float dist;
void setup()
{
  Serial.begin(9600);
  //设置TrgPin为输出状态
  pinMode(TrgPin, OUTPUT);
  // 设置EcoPin为输入状态
  pinMode(EcoPin, INPUT);
}
void loop()
{
  digitalWrite(TrgPin, LOW);
  delayMicroseconds(8);
  digitalWrite(TrgPin, HIGH);
  // 维持10毫秒高电平用来产生一个脉冲
  delayMicroseconds(10);
  digitalWrite(TrgPin, LOW);
  // 读取脉冲的宽度并换算成距离
  dist = pulseIn(EcoPin, HIGH) / 58.00;
  Serial.print("Distance:");
  Serial.print(dist);
  Serial.println("cm");
  delay(300);
}
python代码:
import matplotlib.pyplot as plt
import serial

serialPort = "COM4"  # 串口
baudRate = 9600  # 波特率
ser = serial.Serial(serialPort, baudRate, timeout=0.1)
#print("参数设置:串口=%s ,波特率=%d" % (serialPort, baudRate))


ax = []                    # 定义一个 x 轴的空列表用来接收动态的数据
ay = []                    # 定义一个 y 轴的空列表用来接收动态的数据
plt.ion()                  # 开启一个画图的窗口
i=1

while i<1000:
	str1 = ser.readline()
	str1 = str(str1)
	b = str1.lstrip("b'")
	b = b.lstrip("Distance:")
	b = b.rstrip("'")
	b = b.replace('\\n', '').replace('\\r', '')
	b = b.lstrip()
	b = b.replace('cm', '')
	b = b.lstrip()
	#print(b)
	if b == "":
		b = 0
		#print(b)
	else:
		b = float(b)
		#print(b)

		ax.append(i)           # 添加 i 到 x 轴的数据中
		i=i+1
		ay.append(b)        # 添加 i 的平方到 y 轴的数据中
		plt.clf()             		 # 清除之前画的图
		plt.plot(ax,ay)        # 画出当前 ax 列表和 ay 列表中的值的图形
		plt.pause(0.1)         # 暂停一秒
		plt.ioff()             # 关闭画图的窗口

while 1:
	print("处理完毕!")
以上就是本文的全部内容,关注我学习更多知识
