import pandas as pd
import jieba
from sklearn.feature_extraction.text import CountVectorizer
from sklearn.decomposition import TruncatedSVD
from sklearn.model_selection import train_test_split
from sklearn.naive_bayes import BernoulliNB
from sklearn.metrics import confusion_matrix, classification_report
import matplotlib.pyplot as plt
from wordcloud import WordCloud
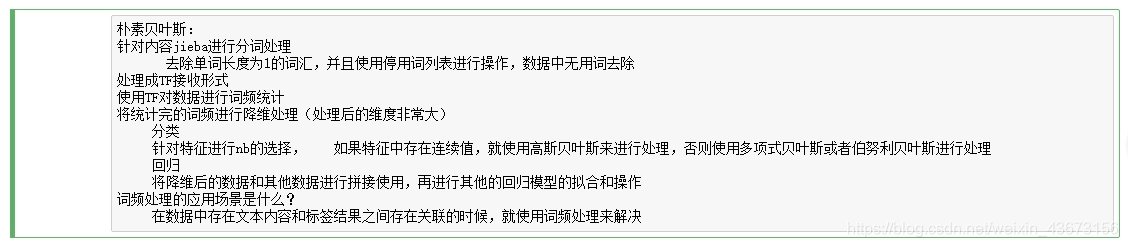
算法朴素贝叶斯哦!!!
对员工的状态分析,看看数据
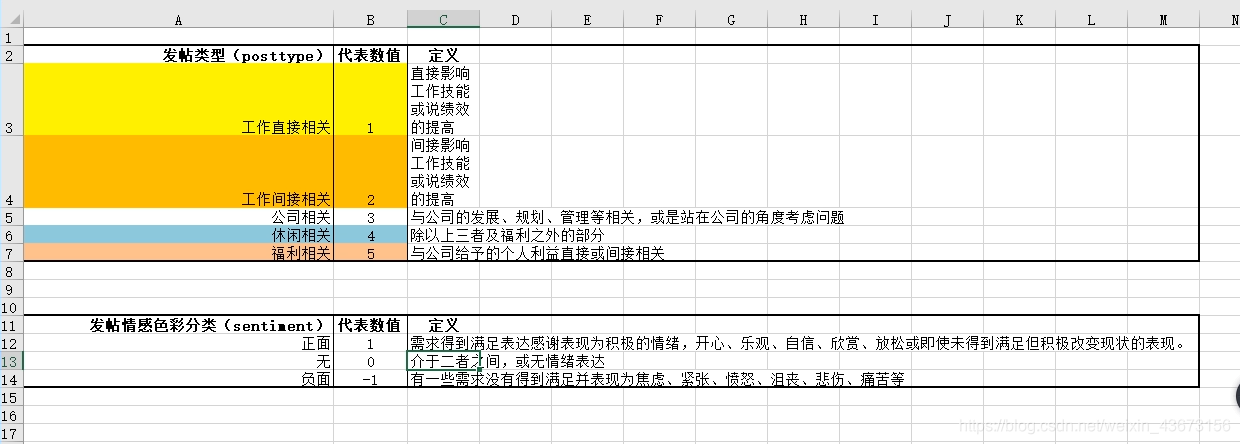 状态也可以说是独热编码的思路。0,1,2表示。
# sheet_name 更换工作表
data = pd.read_excel('./datas/classify.xls', sheet_name='classify')
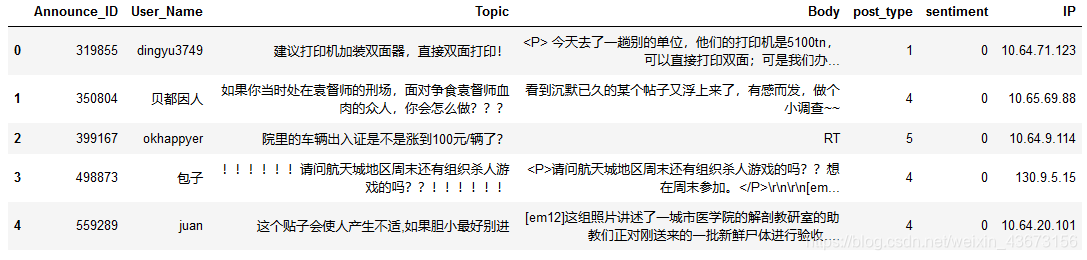
data.head()
下面的数据可能是论坛的数据!!!首先我们要知道哪些数据是有效的,去掉无效数据!你看看Body就很有用!
print(data['post_type'].value_counts())
Ouput

删除无用项
cols = ['User_Name','post_type','IP']
for col in cols:
    del data[col]
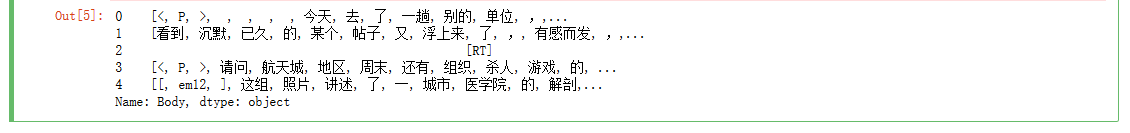
对特征进行jieba分词处理
data['Body'] = data['Body'].map(lambda x:jieba.lcut(x))# 精确模式
data['Body'].head()
 获取停用词表
s = ''
with open('./datas/stopwords.txt',encoding='utf-8',errors='ignore')as sp:
    for word in sp.readlines():
        s += word.strip()#移除指定字符
print(s)
 清除截断词
清除截断词
data['Body'] = data['Body'].map(lambda x:[i for i in x if i not in s if len(i) > 1])
data["Body"].head()
 生成词云
生成词云
wordcloud = WordCloud(background_color="white",width=1000, height=860, margin=2).generate(data['Body'][0])
plt.imshow(wordcloud)
plt.axis("off")
plt.show()

每个单词间加空格区分,方便后去分词处理
data['Body'] = data['Body'].map(lambda line:' '.join(line))
data["Body"].head()
 TF处理
TF处理
X = data['Body'].tolist()
cv = CountVectorizer()
W = cv.fit_transform(X)
数据降维
Tsvd= TruncatedSVD(50)
x = Tsvd.fit_transform(W)
y = data['sentiment']
使用伯努利贝叶斯
X_train, X_test, y_train, y_test = train_test_split(x,y,test_size=0.2)
bnb = BernoulliNB()
bnb.fit(X_train,y_train)
y_pred = bnb.predict(X_test)
print(bnb.score(X_test, y_test))#acc
0.9127659574468086
标签频次统计
data['sentiment'].value_counts()
 0    2235
-1      86
 1      28
Name: sentiment, dtype: int64
分别报告
print(classification_report(y_test,y_pred))
print(confusion_matrix(y_test,y_pred))
              precision    recall  f1-score   support

          -1       0.11      0.10      0.10        21
           0       0.95      0.96      0.95       445
           1       0.00      0.00      0.00         4

   micro avg       0.91      0.91      0.91       470
   macro avg       0.35      0.35      0.35       470
weighted avg       0.90      0.91      0.91       470

[[  2  19   0]
 [ 16 427   2]
 [  0   4   0]]
为什么0类别准确率高,1和-1类别准确率低
1.可以使用多项式朴素贝叶斯
2.严重的类别不平衡问题