#分析网页源代码
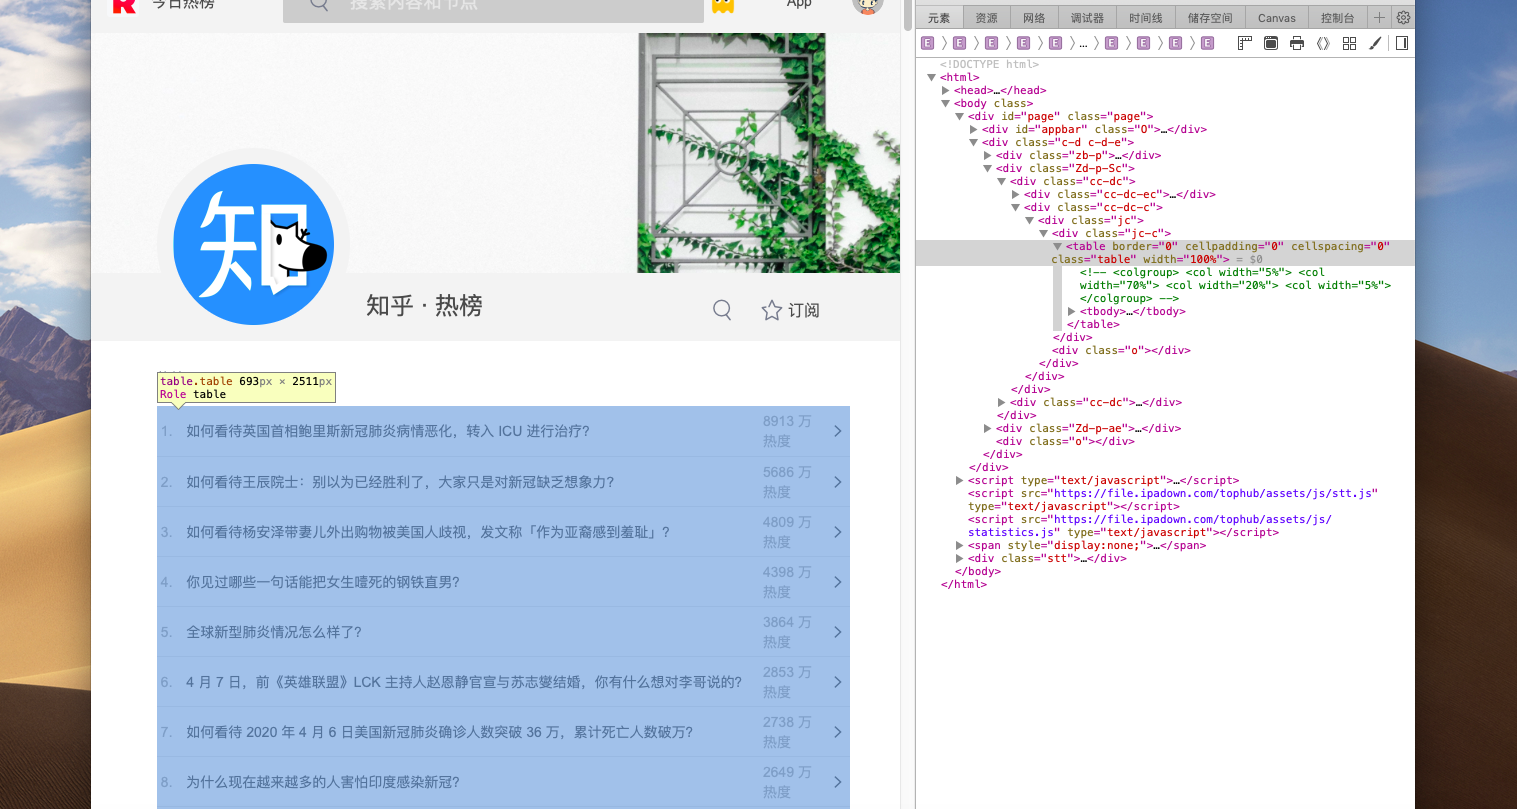

#进行爬虫
#一、爬去所有需要的数据
url='https://tophub.today/n/mproPpoq6O'
#伪装一个标题,能够爬取内容
headers={'user-agent':'45545454'}
#设置延迟
response=requests.get(url,headers=headers,timeout=30)
#获取内容
html=response.text
biaoti=re.findall('<a href=.*? target="_blank" .*?>(.*?)</a>',html)[3:20]
redu=re.findall('<td>(.*?)</td>',html)[0:17]
#print(biaoti)
#print(redu)

#让数据更美观和有条理并且创建一个文件夹
#创建字典
dict = {'内容':biaoti,'阅读数量':redu}
x = pd.DataFrame(dict)
#print(x)
dict=[]
for i in range(16):
dict.append([i+1,biaoti[i],redu[i][:-3]])
#建立一个有关文件夹
file=pd.DataFrame(dict,columns=['排名','知乎今日热榜','热度(单位:万)'])
print(file)
#file.to_csv('/Users/xiaonico/Desktop/知乎热榜数据.csv')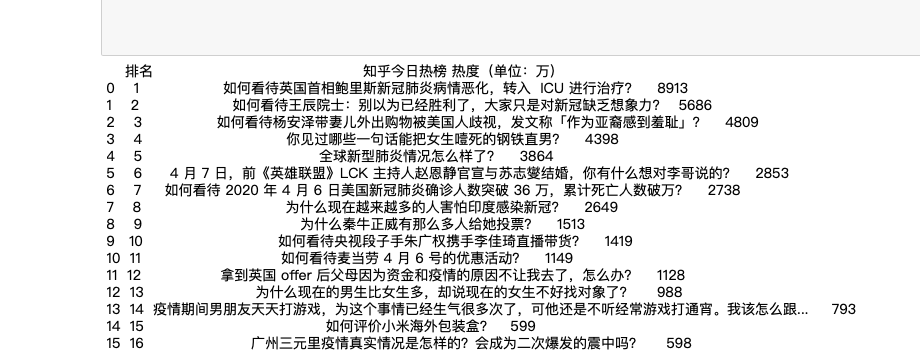
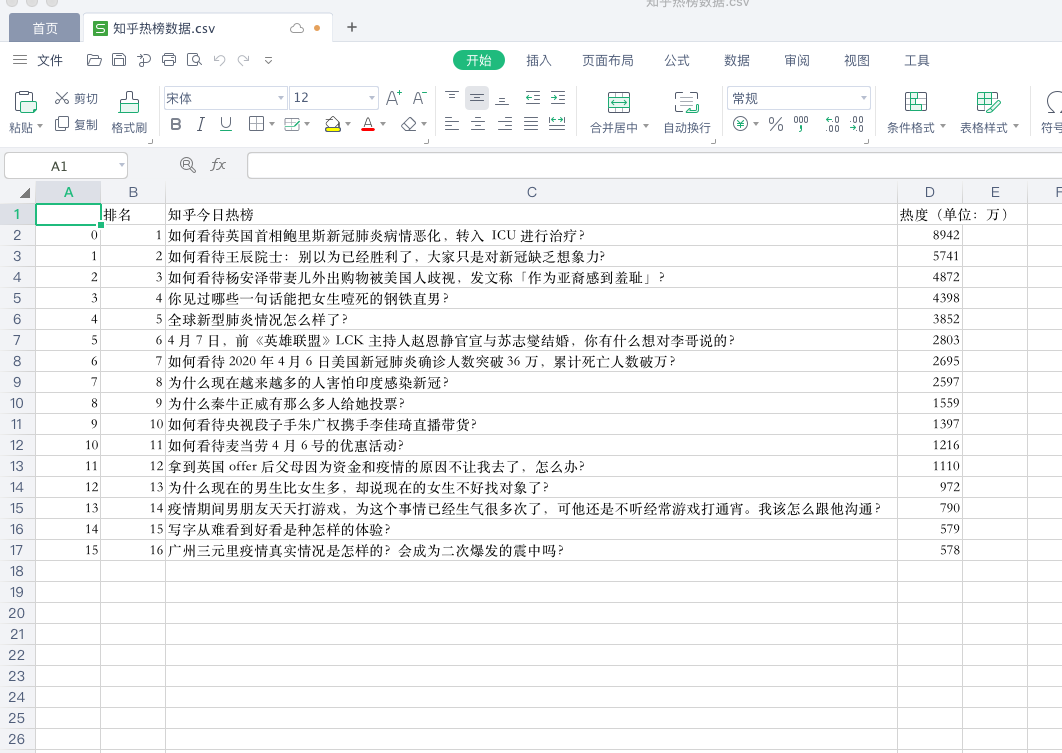
#处理文件
#二、对数据的处理
#读取csv文件
df=pd.DataFrame(pd.read_csv('/Users/xiaonico/Desktop/知乎热榜数据.csv'))
df.head()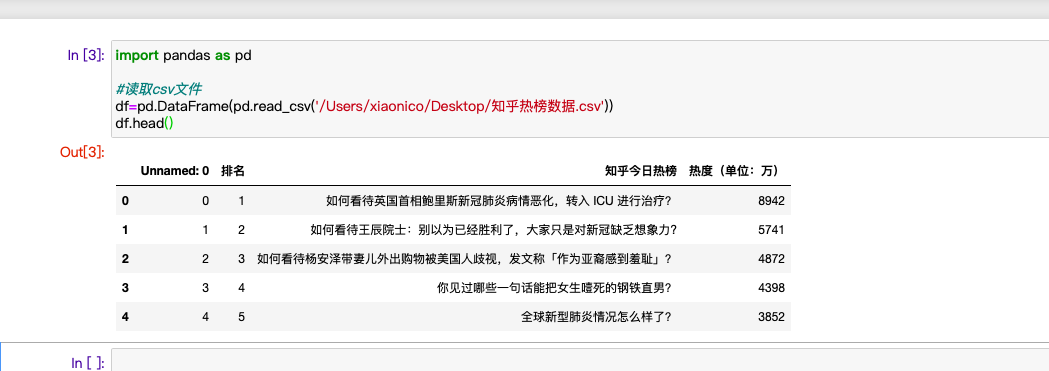
#数据清洗
#进行清洗,去除无效数据
df.drop('知乎今日热榜',axis=1,inplace=Ture)
df.head()
df.isnull().sum()#空值
#缺失值
df[df.isnull().values==True]
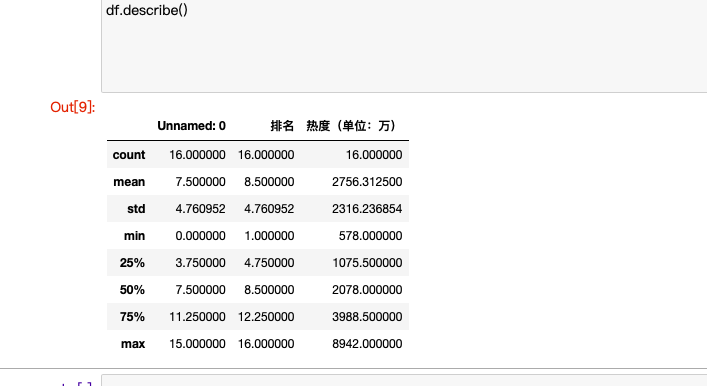
#describe()显示描述性统计指标
df.describe()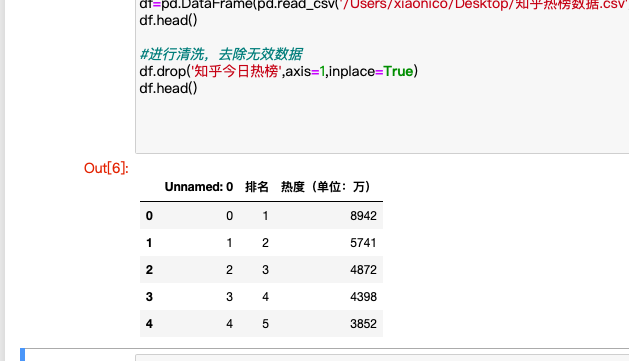


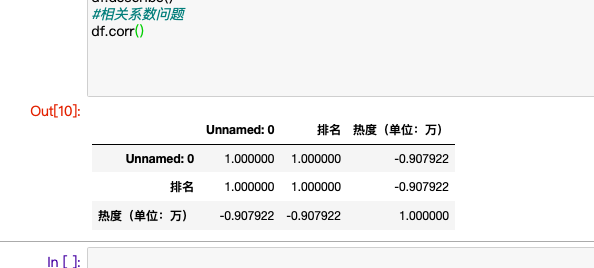
#进行相关数问题
#相关系数问题
df.corr()
#三、数据可视化
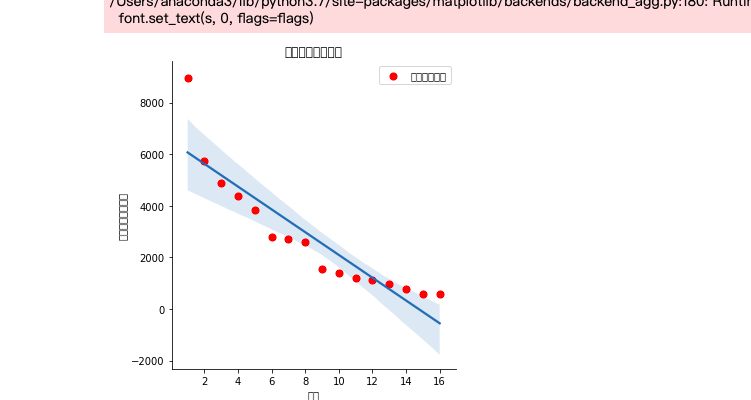
#排名和热度之间的线性关系
sns.lmplot(x='排名',y='热度(单位:万)',data=df)
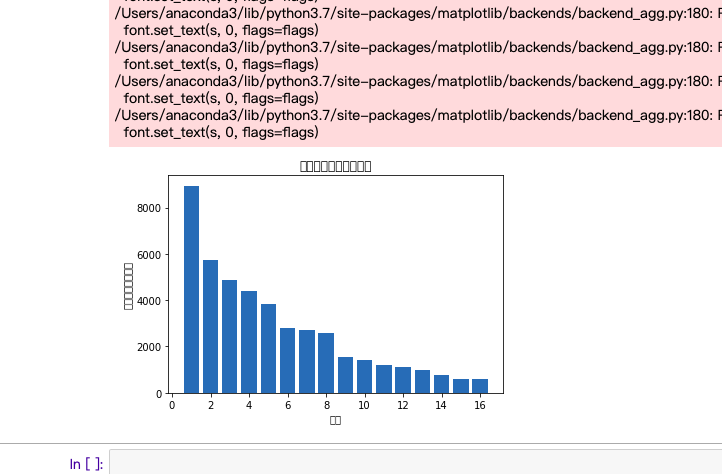
#绘制条形统计图
def build():
file_path = "'知乎热榜数据.csv'"
x = df['排名']
y = df['热度(单位:万)']
plt.xlabel('排名')
plt.ylabel('热度(单位:万)')
plt.bar(x,y)
plt.title("绘制排名与热度条形图")
plt.show()
build()
#画散点图
def sandian():
x = df['排名']
y = df['热度(单位:万)']
plt.xlabel('排名')
plt.ylabel('热度(单位:万)')
plt.scatter(x,y,color="red",label=u"热度分布数据",linewidth=2)
plt.title("排名与热度散点图")
plt.legend()
plt.show()
sandian()
#画折线图
def zhexian():
x = df['排名']
y = df['热度(单位:万)']
plt.xlabel('排名')
plt.ylabel('热度(单位:万)')
plt.plot(x,y)
plt.scatter(x,y)
plt.title("排名与热度折线图")
plt.show()
zhexian()
#进行数据的回归方程不会


#导入需要的库
import requests
import re
import os
import pandas as pd
from bs4 import BeautifulSoup
import seaborn as sns

#一、爬去所有需要的数据
url='https://tophub.today/n/mproPpoq6O'
#伪装一个标题,能够爬取内容
headers={'user-agent':'45545454'}
#设置延迟
response=requests.get(url,headers=headers,timeout=30)
#获取内容
html=response.text
biaoti=re.findall('<a href=.*? target="_blank" .*?>(.*?)</a>',html)[3:20]
redu=re.findall('<td>(.*?)</td>',html)[0:17]
#print(biaoti)
#print(redu)


#print(html)
#用bs4对需要的内容进行编辑
soup=BeautifulSoup(html,'html.parser')
title=soup.find_all('a',class_='list-title')
point=soup.find_all('align',class_='inco_rise')
#print(':^55}'.format('知乎热榜川
#print('t{:^40}\t{:^10}.format( '标题,热度"》


#创建字典
dict = {'内容':biaoti,'阅读数量':redu}
x = pd.DataFrame(dict)
#print(x)


dict=[]
for i in range(16):
    dict.append([i+1,biaoti[i],redu[i][:-3]])

#建立一个有关文件夹
file=pd.DataFrame(dict,columns=['排名','知乎今日热榜','热度(单位:万)'])
print(file)
#file.to_csv('/Users/xiaonico/Desktop/知乎热榜数据.csv')


#二、对数据的处理
#读取csv文件
df=pd.DataFrame(pd.read_csv('/Users/xiaonico/Desktop/知乎热榜数据.csv'))
df.head()

#进行清洗,去除无效数据
df.drop('知乎今日热榜',axis=1,inplace=Ture)
df.head()
df.isnull().sum()#空值
#缺失值
df[df.isnull().values==True]
#describe()显示描述性统计指标
df.describe()


#相关系数问题
df.corr()

#三、数据可视化
#排名和热度之间的线性关系
sns.lmplot(x='排名',y='热度(单位:万)',data=df)


#绘制条形统计图
def build():
    file_path = "'知乎热榜数据.csv'"
    x = df['排名']
    y = df['热度(单位:万)']
    plt.xlabel('排名')
    plt.ylabel('热度(单位:万)')
    plt.bar(x,y)
    plt.title("绘制排名与热度条形图")
    plt.show()
build()


#画散点图
def sandian():
    x = df['排名']
    y = df['热度(单位:万)']
    plt.xlabel('排名')
    plt.ylabel('热度(单位:万)')
    plt.scatter(x,y,color="red",label=u"热度分布数据",linewidth=2)
    plt.title("排名与热度散点图")
    plt.legend()
    plt.show()
sandian()

#画折线图
def zhexian():
    x = df['排名']
    y = df['热度(单位:万)']
    plt.xlabel('排名')
    plt.ylabel('热度(单位:万)')
    plt.plot(x,y)
    plt.scatter(x,y)
    plt.title("排名与热度折线图")
    plt.show()
zhexian()
