1.读取excel
pd.read_excel('animal.xlsx', 'Sheet1', index_col=None, na_values=['NA'])
2.Series 赋值多重索引
pd.read_excel('animal.xlsx', 'Sheet1', index_col=None, na_values=['NA'])
s.loc[:, [1, 3, 6]]
s.loc[pd.IndexSlice[:'B', 5:]]
3.DataFrame 多重索引
frame = pd.DataFrame(np.arange(12).reshape(6, 2),
index=[list('AAABBB'), list('123123')],
columns=['hello', 'shiyanlou'])
frame
frame.index.names = ['first', 'second']
frame
frame.groupby('first').sum()
print(frame)
frame.stack()
print(frame)
frame.unstack()
5 DataFrame 条件查找 0左右 1上下
data = {'animal': ['cat', 'cat', 'snake', 'dog', 'dog', 'cat', 'snake', 'cat', 'dog', 'dog'],
'age': [2.5, 3, 0.5, np.nan, 5, 2, 4.5, np.nan, 7, 3],
'visits': [1, 3, 2, 3, 2, 3, 1, 1, 2, 1],
'priority': ['yes', 'yes', 'no', 'yes', 'no', 'no', 'no', 'yes', 'no', 'no']}
labels = ['a', 'b', 'c', 'd', 'e', 'f', 'g', 'h', 'i', 'j']
df = pd.DataFrame(data, index=labels)
df[df['age'] > 3]
df.iloc[2:4, 1:3]
df = pd.DataFrame(data, index=labels)
df[(df['animal'] == 'cat') & (df['age'] < 3)]
df.loc[df2.index[[3, 4, 8]], ['animal', 'age']]
df.loc[df2.index[[3, 4, 8]] ,df2.columns[[1, 2]]]
df.sort_values(by=['age', 'visits'], ascending=[False, True])
df['priority'].map({'yes': True, 'no': False})
df2.groupby('animal').sum()
temp_df1 = pd.DataFrame(np.random.randn(5, 4))
temp_df2 = pd.DataFrame(np.random.randn(5, 4))
temp_df3 = pd.DataFrame(np.random.randn(5, 4))
print(temp_df1)
print(temp_df2)
print(temp_df3)
pieces = [temp_df1, temp_df2, temp_df3]
pd.concat(pieces)
df = pd.DataFrame(np.random.random(size=(5, 10)), columns=list('abcdefghij'))
print(df)
df.sum().idxmin()
df = pd.DataFrame({'A': list('aaabbcaabcccbbc'),
'B': [12, 345, 3, 1, 45, 14, 4, 52, 54, 23, 235, 21, 57, 3, 87]})
print(df)
df.groupby('A')['B'].nlargest(3).sum(level=0)
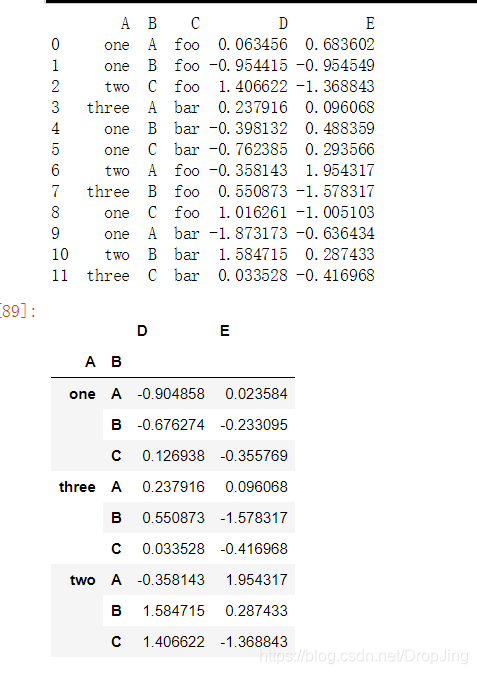
6.数据透视表
df = pd.DataFrame({'A': ['one', 'one', 'two', 'three'] * 3,
                   'B': ['A', 'B', 'C'] * 4,
                   'C': ['foo', 'foo', 'foo', 'bar', 'bar', 'bar'] * 2,
                   'D': np.random.randn(12),
                   'E': np.random.randn(12)})

print(df)

pd.pivot_table(df, index=['A', 'B'])
pd.pivot_table(df, values=['D'], index=['A', 'B'])
pd.pivot_table(df, values=['D'], index=['A', 'B'], aggfunc=[np.sum, len])
pd.pivot_table(df, values=['D'], index=['A', 'B'],
columns=['C'], aggfunc=np.sum)
pd.pivot_table(df, values=['D'], index=['A', 'B'],
columns=['C'], aggfunc=np.sum, fill_value=0)
7.数据清洗
df = pd.DataFrame({'From_To': ['LoNDon_paris', 'MAdrid_miLAN', 'londON_StockhOlm',
'Budapest_PaRis', 'Brussels_londOn'],
'FlightNumber': [10045, np.nan, 10065, np.nan, 10085],
'RecentDelays': [[23, 47], [], [24, 43, 87], [13], [67, 32]],
'Airline': ['KLM(!)', '<Air France> (12)', '(British Airways. )',
'12. Air France', '"Swiss Air"']})
df['FlightNumber'] = df['FlightNumber'].interpolate().astype(int)
print(df)
temp = df.From_To.str.split('_', expand=True)
temp.columns = ['From', 'To']
temp['From'] = temp['From'].str.capitalize()
temp['To'] = temp['To'].str.capitalize()
df = df.drop('From_To', axis=1)
df = df.join(temp)
print(df)
df['Airline'] = df['Airline'].str.extract(
'([a-zA-Z\s]+)', expand=False).str.strip()
df
7.预处理
df = pd.DataFrame({'name': ['Alice', 'Bob', 'Candy', 'Dany', 'Ella',
'Frank', 'Grace', 'Jenny'],
'grades': [58, 83, 79, 65, 93, 45, 61, 88]})
def choice(x):
if x > 60:
return 1
else:
return 0
df.grades = pd.Series(map(lambda x: choice(x), df.grades))
df
df = pd.DataFrame({'A': [1, 2, 2, 3, 4, 5, 5, 5, 6, 7, 7]})
df.loc[df['A'].shift() != df['A']]
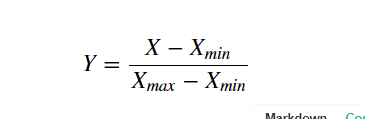
def normalization(df):
numerator = df.sub(df.min())
denominator = (df.max()).sub(df.min())
Y = numerator.div(denominator)
return Y
df = pd.DataFrame(np.random.random(size=(5, 3)))
print(df)
normalization(df)
8.图片表达
%matplotlib inline
ts = pd.Series(np.random.randn(100), index=pd.date_range('today', periods=100))
ts = ts.cumsum()
ts.plot()
df = pd.DataFrame(np.random.randn(100, 4), index=ts.index,
columns=['A', 'B', 'C', 'D'])
df = df.cumsum()
df.plot()
df = pd.DataFrame({"xs": [1, 5, 2, 8, 1], "ys": [4, 2, 1, 9, 6]})
df = df.cumsum()
df.plot.scatter("xs", "ys", color='red', marker="*")
df = pd.DataFrame({"revenue": [57, 68, 63, 71, 72, 90, 80, 62, 59, 51, 47, 52],
"advertising": [2.1, 1.9, 2.7, 3.0, 3.6, 3.2, 2.7, 2.4, 1.8, 1.6, 1.3, 1.9],
"month": range(12)
})
ax = df.plot.bar("month", "revenue", color="yellow")
df.plot("month", "advertising", secondary_y=True, ax=ax)
