目录
注:此笔记来自datawhale团队github开源项目:Joyful-Pandas
前提:pandas包的导入和数据读取
import numpy as np
import pandas as pd
df=pd.read_csv('data/table.csv',index_col='ID')
df.head()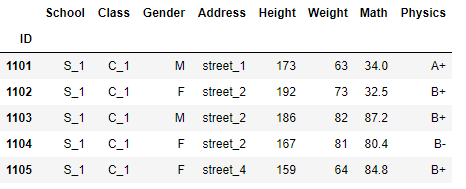
一、SAC过程
1. 内涵
SAC指的是分组操作中的split-apply-combine过程。其中split指基于某一些规则,将数据拆成若干组,apply是指对每一组独立地使用函数,combine指将每一组的结果组合成某一类数据结构
2. apply过程
在该过程中,我们实际往往会遇到四类问题:
整合(Aggregation)——即分组计算统计量(如求均值、求每组元素个数)
变换(Transformation)——即分组对每个单元的数据进行操作(如元素标准化)
过滤(Filtration)——即按照某些规则筛选出一些组(如选出组内某一指标小于50的组)
综合问题——即前面提及的三种问题的混合。
二、groupby函数
1. 指定某些列分组
# 根据某一列分组
grouped_single = df.groupby('School')
grouped_single.get_group('S_1').head()

# 根据某两列分组
grouped_mul = df.groupby(['School','Class'])
grouped_mul.get_group(('S_2','C_4'))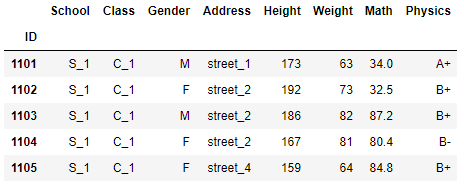
2. 组容量,组数和组的遍历
#组容量
$ grouped_single.size()
School
S_1    15
S_2    20
dtype: int64

# 组数
$ grouped_single.ngroups
2

# 组的遍历
$ for name,group in grouped_single:
      print(name)
      display(group.head())
3. groupby对象的特点
查看可调用的方法:
print([attr for attr in dir(grouped_single) if not attr.startswith('_')])print([attr for attr in dir(grouped_single) if not attr.startswith('_')])['Address', 'Class', 'Gender', 'Height', 'Math', 'Physics', 'School', 'Weight', 'agg', 'aggregate', 'all', 'any', 'apply', 'backfill', 'bfill', 'boxplot', 'corr', 'corrwith', 'count', 'cov', 'cumcount', 'cummax', 'cummin', 'cumprod', 'cumsum', 'describe', 'diff', 'dtypes', 'expanding', 'ffill', 'fillna', 'filter', 'first', 'get_group', 'groups', 'head', 'hist', 'idxmax', 'idxmin', 'indices', 'last', 'mad', 'max', 'mean', 'median', 'min', 'ndim', 'ngroup', 'ngroups', 'nth', 'nunique', 'ohlc', 'pad', 'pct_change', 'pipe', 'plot', 'prod', 'quantile', 'rank', 'resample', 'rolling', 'sem', 'shift', 'size', 'skew', 'std', 'sum', 'tail', 'take', 'transform', 'tshift', 'var']
常用方法
grouped_single.head(2) #对分组对象使用head函数,返回的是每个组的前几行,而不是数据集前几行
grouped_single.first() #first显示的是以分组为索引的每组的第一个分组信息

# 对于groupby函数而言,分组的依据是非常自由的,只要是与数据框长度相同的列表即可,同时支持函数型分组
df.groupby(np.random.choice(['a','b','c'],df.shape[0])).get_group('a').head() #相当于将np.random.choice(['a','b','c'],df.shape[0])当做新的一列进行分组
从原理上说,我们可以看到利用函数时,传入的对象就是索引,因此根据这一特性可以做一些复杂的操作
df[:5].groupby(lambda x:print(x)).head(0)
# 根据奇偶行分组
df.groupby(lambda x:'奇数行' if not df.index.get_loc(x)%2==1 else '偶数行').groups


# 可以用[]选出groupby对象的某个或者某几个列,上面的均分比较可以如下简洁地写出
df.groupby(['Gender','School'])['Math'].mean()>=60
连续型变量分组
# 利用cut函数对数学成绩分组
bins = [0,40,60,80,90,100]
cuts = pd.cut(df['Math'],bins=bins) #可选label添加自定义标签
df.groupby(cuts)['Math'].count()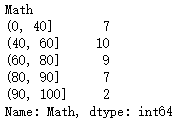
三、聚合、过滤和变换
1. 聚合
a)常用聚合函数
所谓聚合就是把一堆数,变成一个标量,因此mean/sum/size/count/std/var/sem/describe/first/last/nth/min/max都是聚合函数
#验证标准误sem函数
group_m = grouped_single['Math']
group_m.std().values/np.sqrt(group_m.count().values)== group_m.sem().values
b)同时使用多个聚合函数
group_m.agg(['sum','mean','std'])# 利用元组进行重命名
group_m.agg([('rename_sum','sum'),('rename_mean', 'mean')])
#指定哪些函数作用哪些列
grouped_mul.agg({'Math':['mean','max'],'Height':'var'})
c)使用自定义函数
grouped_single['Math'].agg(lambda x:print(x.head(),'间隔'))
#可以发现,agg函数的传入是分组逐列进行的,有了这个特性就可以做许多事情


# 组内极差计算
grouped_single['Math'].agg(lambda x:x.max()-x.min())
d)利用NamedAgg函数进行多个聚合
e)带参数的聚合函数
2. 过滤
filter函数是用来筛选某些组的(务必记住结果是组的全体),因此传入的值应当是布尔标量
grouped_single[['Math','Physics']].filter(lambda x:(x['Math']>32).all()).head()
3. 变换
a) 传入对象
transform函数中传入的对象是组内的列,并且返回值需要与列长完全一致
grouped_single[['Math','Height']].transform(lambda x:x-x.min()).head()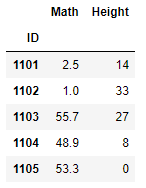
如果返回了标量值,那么组内的所有元素会被广播为这个值
grouped_single[['Math','Height']].transform(lambda x:x.mean()).head()
b) 利用变换方法进行组内标准化
grouped_single[['Math','Height']].transform(lambda x:(x-x.mean())/x.std()).head()
c) 利用变换方法进行组内缺失值的填充
# 设置一些缺失值
df_nan = df[['Math','School']].copy().reset_index()
df_nan.loc[np.random.randint(0,df.shape[0],25),['Math']]=np.nan
df_nan.head()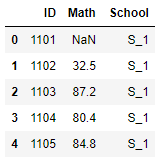
# 缺失值替换
df_nan.groupby('School').transform(lambda x: x.fillna(x.mean())).join(df.reset_index()['School']).head()
四、apply函数
1. apply函数的灵活性
在所有的分组函数中,apply是应用最为广泛的,这得益于它的灵活性,apply函数的灵活性很大程度来源于其返回值的多样性
a)标量返回值
df[['School','Math','Height']].groupby('School').apply(lambda x:x.max())
b)列表返回值
df[['School','Math','Height']].groupby('School').apply(lambda x:x-x.min()).head()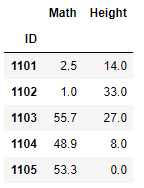
c) 数据框返回值
df[['School','Math','Height']].groupby('School')\
    .apply(lambda x:pd.DataFrame({'col1':x['Math']-x['Math'].max(),
                                  'col2':x['Math']-x['Math'].min(),
                                  'col3':x['Height']-x['Height'].max(),
                                  'col4':x['Height']-x['Height'].min()})).head()
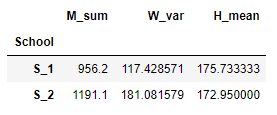
2. 用apply同时统计多个指标
此处可以借助OrderedDict工具进行快捷的统计:
from collections import OrderedDict
def f(df):
    data = OrderedDict()
    data['M_sum'] = df['Math'].sum()
    data['W_var'] = df['Weight'].var()
    data['H_mean'] = df['Height'].mean()
    return pd.Series(data)
grouped_single.apply(f)