文章目录
pprof模块
Go语言项目中的性能优化主要有以下几个方面:
- CPU profile:报告程序的 CPU 使用情况,按照一定频率去采集应用程序在 CPU 和寄存器上面的数据
- Memory Profile(Heap Profile):报告程序的内存使用情况
- Block Profiling:报告 goroutines 不在运行状态的情况,可以用来分析和查找死锁等性能瓶颈
- Goroutine Profiling:报告 goroutines 的使用情况,有哪些 goroutine,它们的调用关系是怎样的
Go语言内置了获取程序的运行数据的工具,包括以下两个标准库:
runtime/pprof:采集工具型应用运行数据进行分析net/http/pprof:采集服务型应用运行时数据进行分析
pprof开启后,每隔一段时间(10ms)就会收集下当前的堆栈信息,获取格格函数占用的CPU以及内存资源;最后通过对这些采样数据进行分析,形成一个性能分析报告。
注意,我们只应该在性能测试的时候才在代码中引入pprof。
准备工具
图形化工具
- 安装pprof工具包
go get -u github.com/google/pprof
正常分析使用go tool pprof即可,无需安装此包。但是如果需要火焰图的话,目前还是要安装pprof包才行。
- 安装graphviz,以支持火焰图
这个需要在服务器端安装,可以使用各个操作系统的包管理工具,或者选择源码安装:
brew install graphviz # for macos
apt-get install graphviz # for ubuntu
yum install graphviz # for centos
为什么提示在服务端安装
如果服务端和客户端在同一台机器上不存这个问题
但是如果服务端和客户端不在同一台机器上,你需要知道graphviz装在哪
压测工具
不详细介绍,如果有需要的话,可以使用
https://github.com/wg/wrk 或 https://github.com/adjust/go-wrk
go-torch
go-torch是uber开源的工具,主要用于生成火焰图。官方地址:https://github.com/uber/go-torch
但是从Go 1.11开始,火焰图形可视化go tool pprof直接可用!所以go-torch已经废弃并归档,推荐使用go tool pprof
工具型应用
如果你的应用程序是运行一段时间就结束退出类型。那么最好的办法是在应用退出的时候把 profiling 的报告保存到文件中,进行分析。对于这种情况,可以使用runtime/pprof库。 首先在代码中导入runtime/pprof工具:
import "runtime/pprof"
网上示例代码:
package main

import (
    "flag"
    "fmt"
    "log"
    "os"
    "runtime/pprof"
)

var (
    cpuprofile = flag.String("cpuprofile", "", "write cpu profile to file.")
)

func main() {
    log.Println("begin")
    flag.Parse()

    if *cpuprofile != "" {
        f, err := os.Create(*cpuprofile)
        if err != nil {
            log.Fatal(err)
        }

        pprof.StartCPUProfile(f)  // 开启CPU性能分析
        defer pprof.StopCPUProfile()  // 停止CPU性能分析
    }

    for i := 0; i < 30; i++ {
        nums := fibonacci(i)
        fmt.Println(nums)
    }
}

func fibonacci(num int) int {
    if num < 2 {
        return 1
    }
    return fibonacci(num-1) + fibonacci(num-2)
}
注意这两句,分析CPU性能:
pprof.StartCPUProfile(f)  // 开启CPU性能分析
defer pprof.StopCPUProfile()  // 停止CPU性能分析
创建名字为test.go的go文件,并写入上述代码,执行命令go build test.go。运行程序的时候加一个--cpuprofile参数,比如./test --cpuprofile=cpu.prof。
这样程序运行的时候的CPU profiling 数据就会记录到cpu.prof中了,然后就可以使用go tool pprof工具进行CPU性能分析。
内存性能优化使用:
pprof.WriteHeapProfile(w io.Writer)
服务型应用
如果你的应用程序是一直运行的,比如 web 应用,那么可以使用net/http/pprof库,它能够在提供 HTTP 服务进行分析。
如果使用了默认的http.DefaultServeMux(通常是代码直接使用 http.ListenAndServe(“0.0.0.0:8000”, nil),只需要在你的web server端代码中按如下方式导入net/http/pprof
import _ "net/http/pprof" //注意下划线
网上示例代码:
package main
import (
    _ "net/http/pprof"
    "net/http"
)
func main() {
    http.ListenAndServe("0.0.0.0:8000", nil)
}
非常简单,文件名为test.go,直接运行:
go run test.go
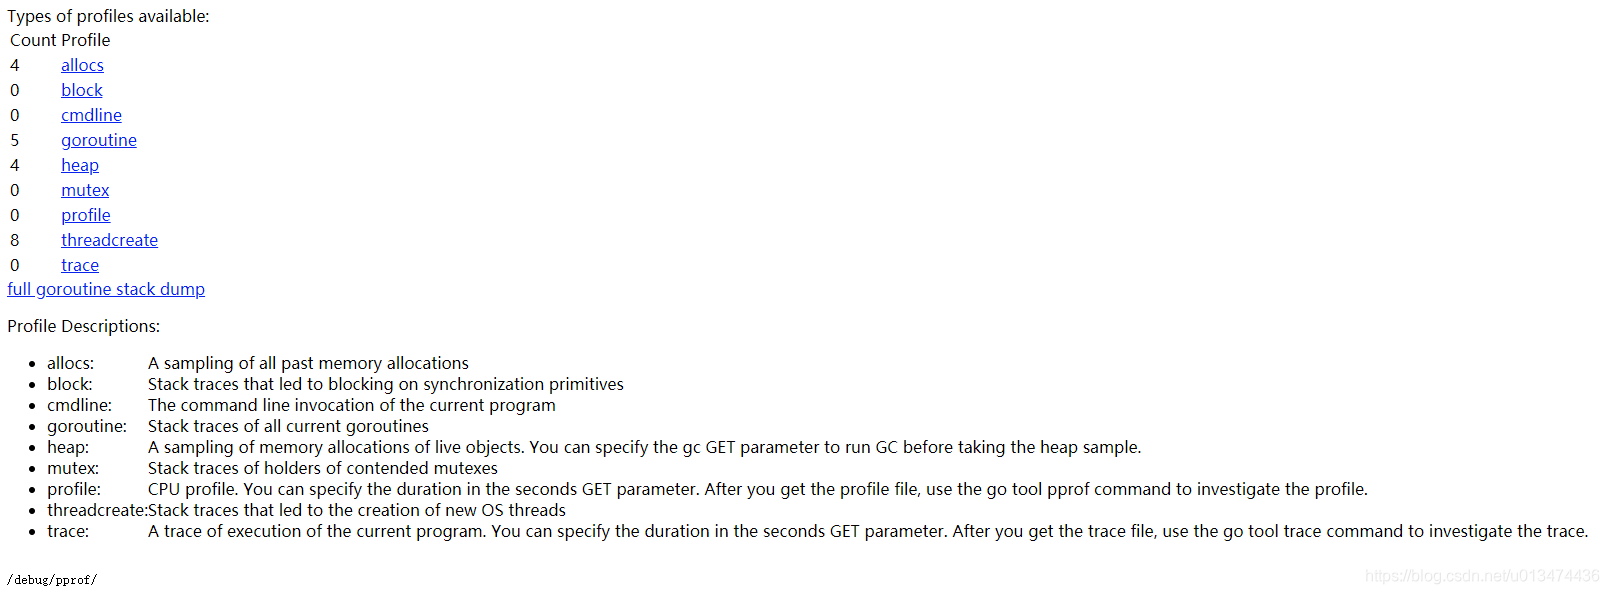
你的 HTTP 服务都会多出/debug/pprof endpoint,然后在浏览器中访问它,localhost可替换成自己的服务器IP:
http://localhost:8082/debug/pprof/
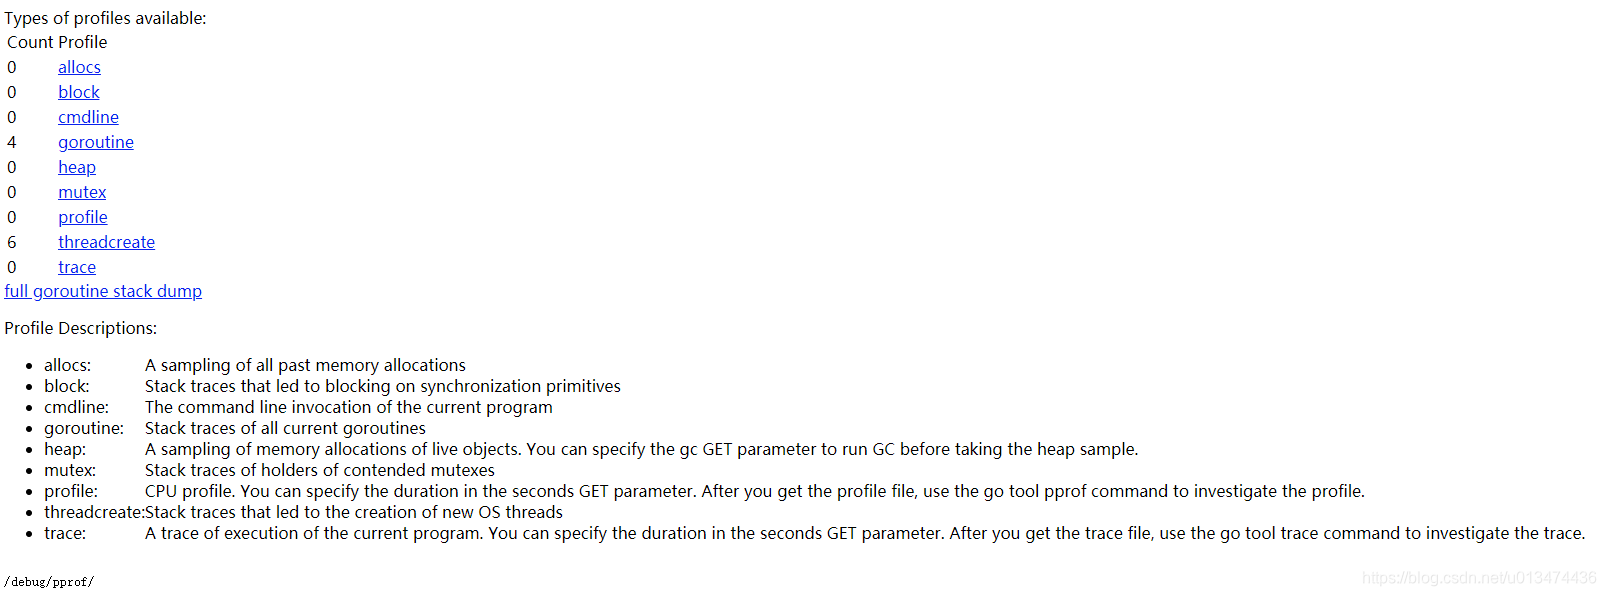
这个路径下还有几个子页面:
| 类型 | 描述 | 备注 |
|---|---|---|
| allocs | 内存分配情况的采样信息 | 可以用浏览器打开,但可读性不高 |
| blocks | 阻塞操作情况的采样信息 | 可以用浏览器打开,但可读性不高 |
| cmdline | 显示程序启动命令及参数 | 可以用浏览器打开 |
| goroutine | 当前所有协程的堆栈信息 | 可以用浏览器打开,但可读性不高 |
| heap | 堆上内存使用情况的采样信息 | 可以用浏览器打开,但可读性不高 |
| mutex | 锁争用情况的采样信息 | 可以用浏览器打开,但可读性不高 |
| profile | CPU占用情况的采样信息, 持续 30s | 浏览器打开会下载文件 |
| threadcreate | 系统线程创建情况的采样信息 | 可以用浏览器打开,但可读性不高 |
| trace | 程序运行跟踪信息 | 浏览器打开会下载文件 |
Gin框架使用pprof
有两个包可以用:
package main

import (
	"github.com/gin-contrib/pprof"
	"github.com/gin-gonic/gin"
)

func main() {
  router := gin.Default()
  pprof.Register(router)
  router.Run(":8080")
}
package main

import (
	"github.com/gin-gonic/gin"
	"github.com/DeanThompson/ginpprof"
)

func main() {
	router := gin.Default()
	ginpprof.Wrap(router)
	router.Run(":8080")
}
注意:
如果使用router.Use(gzip.Gzip(gzip.DefaultCompression))等类似功能的方法需要注释掉,否则浏览器打开页面会触发下载
pprof与性能测试结合
go test命令有两个参数和 pprof 相关,它们分别指定生成的 CPU 和 Memory profiling 保存的文件:
- cpuprofile:cpu profiling 数据要保存的文件地址
- memprofile:memory profiling 数据要报文的文件地址
我们还可以选择将pprof与性能测试相结合,比如:
下面执行测试的同时,也会执行 CPU profiling,并把结果保存在 cpu.prof 文件中:
go test -bench . -cpuprofile=cpu.prof
下面执行测试的同时,也会执行 Mem profiling,并把结果保存在 cpu.prof 文件中:
go test -bench . -memprofile=./mem.prof
上边两个例子生成的.prof文件,是给go tool pprof使用的。
需要注意的是,Profiling 一般和性能测试一起使用,只有应用在负载高的情况下 Profiling 才有意义。
go tool pprof命令
介绍
前文写了很多生成采集数据文件的方式,但是并没有写这种数据文件如何使用。
这种文件是二进制文件,无法直接打开,需要go tool pprof命令来进行解析。
不管是工具型应用还是服务型应用,我们使用相应的pprof库获取数据之后,下一步都要对这些数据进行分析,我们可以使用go tool pprof命令行工具。
go tool pprof最简单的使用方式为:
go tool pprof [binary] [source]
其中:
- binary 是应用的二进制文件,用来解析各种符号;
- source 表示 profile 数据的来源,可以是本地的文件,也可以是 http 地址。
注意事项: 获取的 Profiling 数据是动态的,要想获得有效的数据,请保证应用处于较大的负载(比如正在生成中运行的服务,或者通过其他工具模拟访问压力)。否则如果应用处于空闲状态,得到的结果可能没有任何意义。
图形化展示
我现在启用一个使用Gin框架的web服务,使用github.com/gin-contrib/pprof包分析。
本节重点介绍go tool pprof的使用,且项目代码较多,就不贴代码了。如想自己测试按照前边讲的做就可以。
$ go run main.go
[GIN-debug] [WARNING] Running in "debug" mode. Switch to "release" mode in production.
 - using env:   export GIN_MODE=release
 - using code:  gin.SetMode(gin.ReleaseMode)

[GIN-debug] GET    /debug/pprof/             --> github.com/DeanThompson/ginpprof.IndexHandler.func1 (3 handlers)
[GIN-debug] GET    /debug/pprof/heap         --> github.com/DeanThompson/ginpprof.HeapHandler.func1 (3 handlers)
[GIN-debug] GET    /debug/pprof/goroutine    --> github.com/DeanThompson/ginpprof.GoroutineHandler.func1 (3 handlers)
[GIN-debug] GET    /debug/pprof/allocs       --> github.com/DeanThompson/ginpprof.AllocsHandler.func1 (3 handlers)
[GIN-debug] GET    /debug/pprof/block        --> github.com/DeanThompson/ginpprof.BlockHandler.func1 (3 handlers)
[GIN-debug] GET    /debug/pprof/threadcreate --> github.com/DeanThompson/ginpprof.ThreadCreateHandler.func1 (3 handlers)
[GIN-debug] GET    /debug/pprof/cmdline      --> github.com/DeanThompson/ginpprof.CmdlineHandler.func1 (3 handlers)
[GIN-debug] GET    /debug/pprof/profile      --> github.com/DeanThompson/ginpprof.ProfileHandler.func1 (3 handlers)
[GIN-debug] GET    /debug/pprof/symbol       --> github.com/DeanThompson/ginpprof.SymbolHandler.func1 (3 handlers)
[GIN-debug] POST   /debug/pprof/symbol       --> github.com/DeanThompson/ginpprof.SymbolHandler.func1 (3 handlers)
[GIN-debug] GET    /debug/pprof/trace        --> github.com/DeanThompson/ginpprof.TraceHandler.func1 (3 handlers)
[GIN-debug] GET    /debug/pprof/mutex        --> github.com/DeanThompson/ginpprof.MutexHandler.func1 (3 handlers)
[GIN-debug] Listening and serving HTTP on :8080
我使用了开发debug模式启动服务,可以看到系统自动增加了很多/debug/pprof的api。
然后在浏览器中打开/debug/pprof:
这个页面应该不陌生吧。对,这也是一个典型的服务型应用分析。
下边介绍其他的用法:
我们再新建一个终端窗口输入以下命令,当前所有协程的堆栈信息:
go tool pprof --seconds 20 http://localhost:8080/debug/pprof/goroutine
这句话的意思,采集cpu数据并持续20s
也可以用另一种写法:
go tool pprof http://localhost:8080/debug/pprof/goroutine?second=20
看一下执行结果:
$ go tool pprof --seconds 20 http://localhost:8080/debug/pprof/goroutine
Fetching profile over HTTP from http://localhost:8080/debug/pprof/goroutine?seconds=20
Please wait... (20s)
Saved profile in /home/server/pprof/pprof.main.goroutine.001.pb.gz
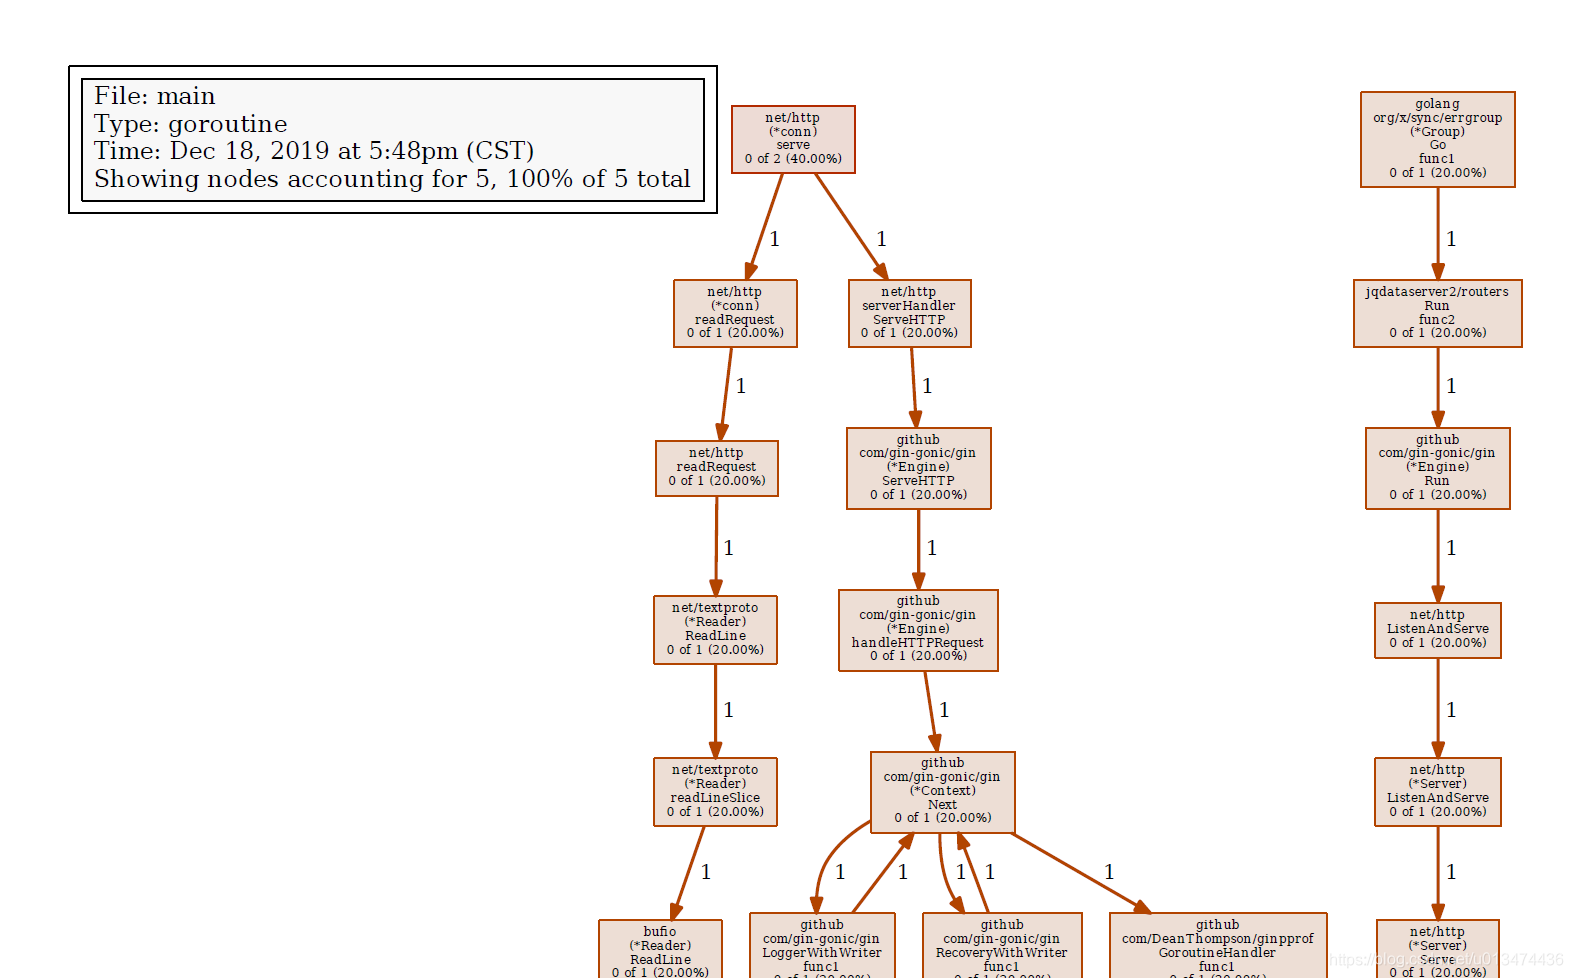
File: main
Type: goroutine
Time: Dec 18, 2019 at 5:48pm (CST)
Entering interactive mode (type "help" for commands, "o" for options)
(pprof)
其实现在已经进入了命令行模式,在最后一行的(pprof)后输入web,会自动打开本地浏览器并访问页面,当然这仅限于图形化界面系统,如MacOS、Ubuntu、Windows等。如果你的操作系统不是,可能是下边结果:
(pprof) web
Couldn't find a suitable web browser!
Set the BROWSER environment variable to your desired browser.
(pprof)
这时怎么办呢,请注意上边第四行的Saved profile,后边的/home/server/pprof/pprof.main.goroutine.001.pb.gz就是我们需要的文件。怎么使用这个文件呢?
我们再新建一个终端窗口输入以下命令:
go tool pprof -http=0.0.0.0:8081 /home/server/pprof/pprof.main.goroutine.001.pb.gz
注意这时需要个新的端口(8081),不能和之前的端口(8080)相同。
然后直接在浏览器中访问http://localhost:8081/,注意修改ip:
如果你没有安装graphviz,会出现 Could not execute dot; may need to install graphviz。
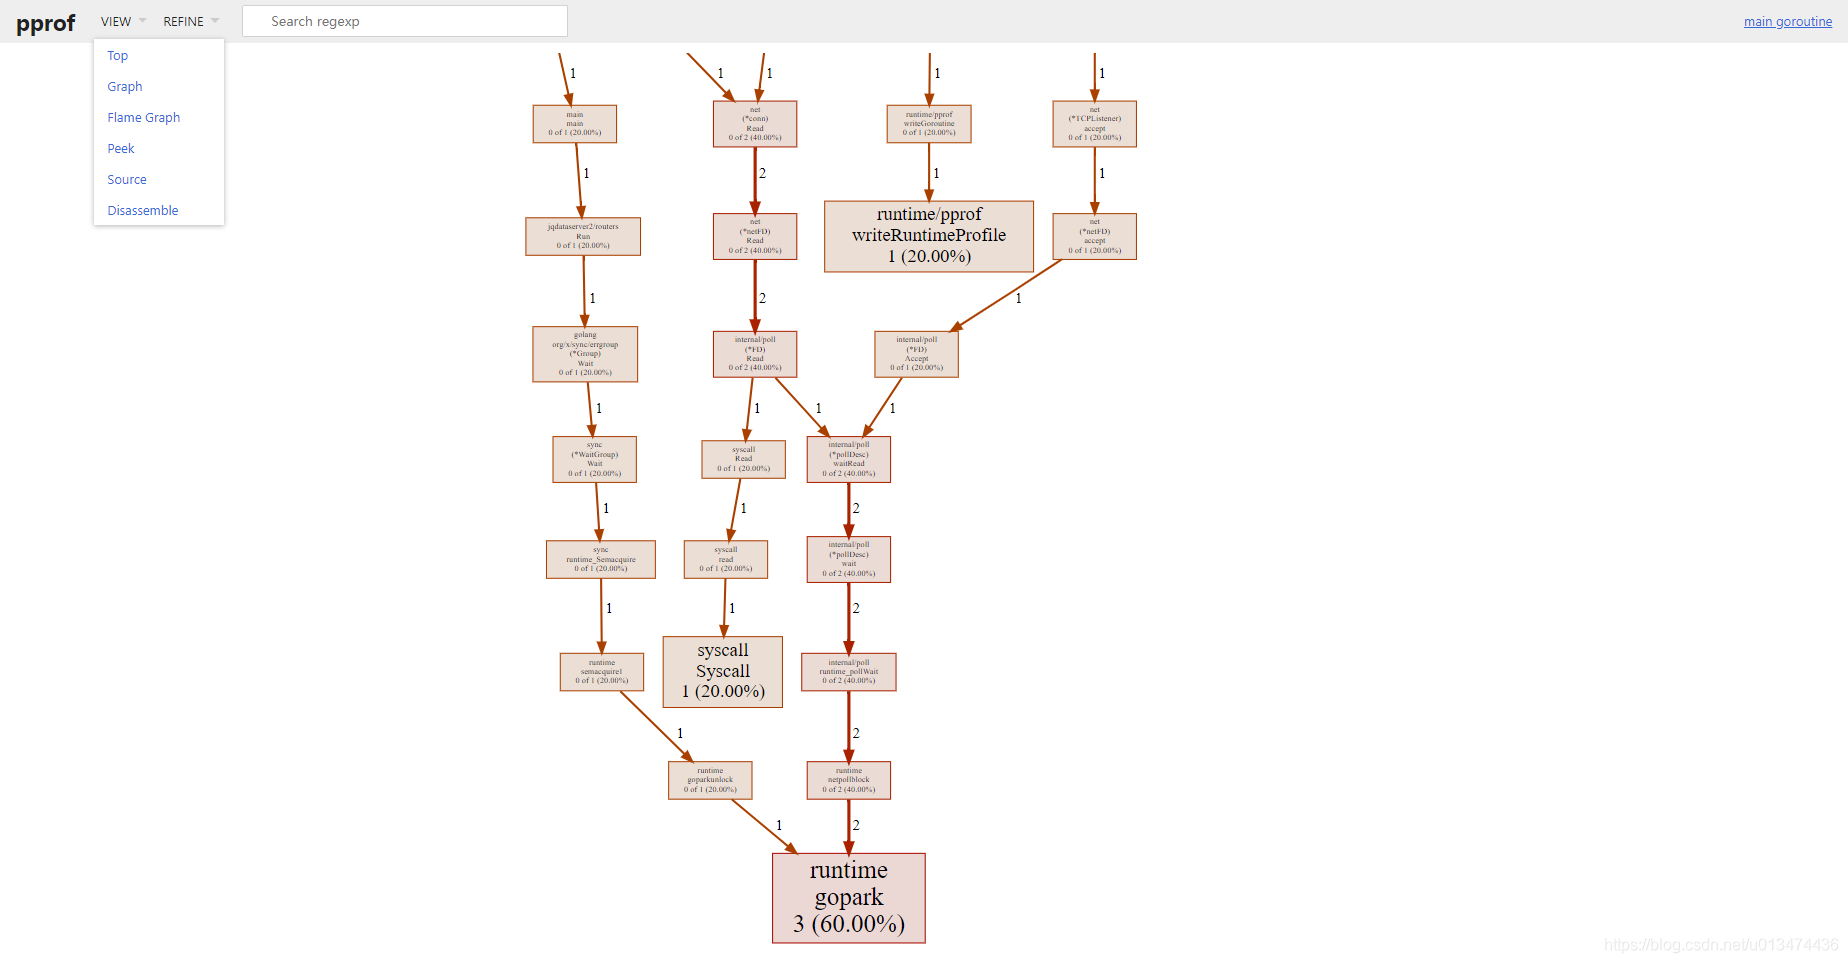
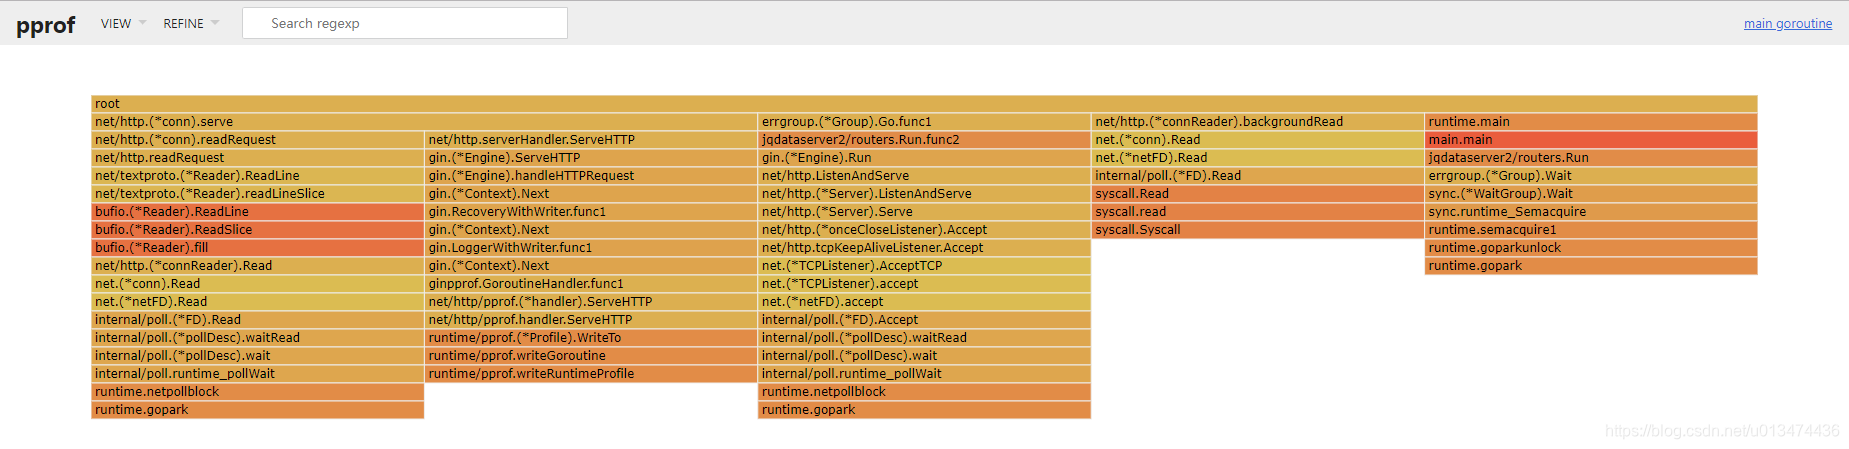
此时我们就看到了图形化的函数调用的堆栈信息。右上角的VIEW栏有一些选项,你可以每个点开看一看,我就不挨个介绍了,不过第三个Flame Graph你应该喜欢,因为它就是火焰图:
命令行交互界面
接下来简单介绍一下go tool pprof命令行的使用,上一节里我们遇到了一个命令,就是web。这节再介绍几个常用的命令。
top
top 默认查看程序中占用CPU前10位的函数
top3 可以查看程序中占用CPU前3位的函数:
(pprof) top
Showing nodes accounting for 5, 100% of 5 total
Showing top 10 nodes out of 53
      flat  flat%   sum%        cum   cum%
         3 60.00% 60.00%          3 60.00%  runtime.gopark
         1 20.00% 80.00%          1 20.00%  runtime/pprof.writeRuntimeProfile
         1 20.00%   100%          1 20.00%  syscall.Syscall
         0     0%   100%          1 20.00%  bufio.(*Reader).ReadLine
         0     0%   100%          1 20.00%  bufio.(*Reader).ReadSlice
         0     0%   100%          1 20.00%  bufio.(*Reader).fill
         0     0%   100%          1 20.00%  github.com/DeanThompson/ginpprof.GoroutineHandler.func1
         0     0%   100%          1 20.00%  github.com/gin-gonic/gin.(*Context).Next
         0     0%   100%          1 20.00%  github.com/gin-gonic/gin.(*Engine).Run
         0     0%   100%          1 20.00%  github.com/gin-gonic/gin.(*Engine).ServeHTTP
(pprof) top3
Showing nodes accounting for 5, 100% of 5 total
Showing top 3 nodes out of 53
      flat  flat%   sum%        cum   cum%
         3 60.00% 60.00%          3 60.00%  runtime.gopark
         1 20.00% 80.00%          1 20.00%  runtime/pprof.writeRuntimeProfile
         1 20.00%   100%          1 20.00%  syscall.Syscall
其中:
- flat:当前函数占用CPU的耗时
- flat::当前函数占用CPU的耗时百分比
- sun%:函数占用CPU的耗时累计百分比
- cum:当前函数加上调用当前函数的函数占用CPU的总耗时
- cum%:当前函数加上调用当前函数的函数占用CPU的总耗时百分比
- 最后一列:函数名称
在大多数的情况下,我们可以通过分析这五列得出一个应用程序的运行情况,并对程序进行优化。
list
我们还可以使用list 函数名命令查看具体的函数分析,例如执行list gopark查看我们编写的函数的详细分析。
(pprof) list gopark
Total: 5
ROUTINE ======================== runtime.gopark in /usr/local/go/src/runtime/proc.go
         3          3 (flat, cum) 60.00% of Total
         .          .    297:   gp.waitreason = reason
         .          .    298:   mp.waittraceev = traceEv
         .          .    299:   mp.waittraceskip = traceskip
         .          .    300:   releasem(mp)
         .          .    301:   // can't do anything that might move the G between Ms here.
         3          3    302:   mcall(park_m)
         .          .    303:}
         .          .    304:
         .          .    305:// Puts the current goroutine into a waiting state and unlocks the lock.
         .          .    306:// The goroutine can be made runnable again by calling goready(gp).
         .          .    307:func goparkunlock(lock *mutex, reason waitReason, traceEv byte, traceskip int) {
ROUTINE ======================== runtime.goparkunlock in /usr/local/go/src/runtime/proc.go
         0          1 (flat, cum) 20.00% of Total
         .          .    303:}
         .          .    304:
         .          .    305:// Puts the current goroutine into a waiting state and unlocks the lock.
         .          .    306:// The goroutine can be made runnable again by calling goready(gp).
         .          .    307:func goparkunlock(lock *mutex, reason waitReason, traceEv byte, traceskip int) {
         .          1    308:   gopark(parkunlock_c, unsafe.Pointer(lock), reason, traceEv, traceskip)
         .          .    309:}
         .          .    310:
         .          .    311:func goready(gp *g, traceskip int) {
         .          .    312:   systemstack(func() {
         .          .    313:           ready(gp, traceskip, true)
(pprof)
pdf可以生成可视化pdf文件:
(pprof) pdf
Generating report in profile001.pdf
(pprof)
profile001.pdf文件就在当前目录下
help
其他文件格式执行pprof help查看命令说明。
(pprof) help
  Commands:
    callgrind        Outputs a graph in callgrind format
    comments         Output all profile comments
    disasm           Output assembly listings annotated with samples
    dot              Outputs a graph in DOT format
    eog              Visualize graph through eog
    evince           Visualize graph through evince
    gif              Outputs a graph image in GIF format
    gv               Visualize graph through gv
    kcachegrind      Visualize report in KCachegrind
    list             Output annotated source for functions matching regexp
    pdf              Outputs a graph in PDF format
    peek             Output callers/callees of functions matching regexp
    png              Outputs a graph image in PNG format
    proto            Outputs the profile in compressed protobuf format
    ps               Outputs a graph in PS format
    raw              Outputs a text representation of the raw profile
    svg              Outputs a graph in SVG format
    tags             Outputs all tags in the profile
    text             Outputs top entries in text form
    top              Outputs top entries in text form
    topproto         Outputs top entries in compressed protobuf format
    traces           Outputs all profile samples in text form
    tree             Outputs a text rendering of call graph
    web              Visualize graph through web browser
    weblist          Display annotated source in a web browser
    o/options        List options and their current values
    quit/exit/^D     Exit pprof
参考
Go pprof性能调优
golang pprof 实战
pprof (golang 性能监控与分析)
Golang性能调优(go-torch, go tool pprof)
