文章目录
前言
pprof性能工具的使用
一、cpu
1.下载实例代码
实例代码地址https://github.com/wolfogre/go-pprof-practice
2.运行项目中的main.go文件
go run main.go
3.查看CPU性能数据
D:\program\goPath\src\bytedance\go-pprof-practice>go tool pprof "http://localhost:6060/debug/pprof/profile?seconds=10"
Fetching profile over HTTP from http://localhost:6060/debug/pprof/profile?seconds=10
Saved profile in C:\Users\helloworld\pprof\pprof.samples.cpu.001.pb.gz
Type: cpu
Time: May 12, 2022 at 8:51am (CST)
Duration: 10.12s, Total samples = 5.43s (53.68%)
Entering interactive mode (type "help" for commands, "o" for options)
(pprof) top
Showing nodes accounting for 5.30s, 97.61% of 5.43s total
Dropped 27 nodes (cum <= 0.03s)
Showing top 10 nodes out of 18
      flat  flat%   sum%        cum   cum%
     4.62s 85.08% 85.08%      4.62s 85.08%  bytedance/go-pprof-practice/animal/felidae/tiger.(*Tiger).Eat
     0.60s 11.05% 96.13%      0.60s 11.05%  runtime.stdcall3
     0.04s  0.74% 96.87%      0.05s  0.92%  runtime.netpoll
     0.02s  0.37% 97.24%      0.11s  2.03%  runtime.park_m
     0.01s  0.18% 97.42%      0.06s  1.10%  runtime.bgscavenge
     0.01s  0.18% 97.61%      0.09s  1.66%  runtime.findrunnable
         0     0% 97.61%      4.62s 85.08%  bytedance/go-pprof-practice/animal/felidae/tiger.(*Tiger).Live
         0     0% 97.61%      4.64s 85.45%  main.main
         0     0% 97.61%      0.64s 11.79%  runtime.(*pageAlloc).scavenge
         0     0% 97.61%      0.62s 11.42%  runtime.(*pageAlloc).scavengeOne
(pprof) top3
4.使用topN(N是可选的数量,也可以不加直接运行)命令来查看占用资源最多的函数
参数说明:
- flat:当前函数本身的执行耗时
- flat%:flat占CPU总时间的比例
- sum%:上面每一行的flat%总和
- cum:指当前函数本身加上器调用函数的总耗时
- cum%:cum占CPU总时间的比例
Q1:什么情况下 flat =cum值,如上面的4.62s?
A1:函数中没有调用其他函数
Q2:什么情况下flat = 0?
A2:函数只有其他函数的调用.
5.查看可能存在问题的具体函数代码
使用【list 函数名 】命令来查看
(pprof) list Eat
Total: 5.43s
ROUTINE ======================== bytedance/go-pprof-practice/animal/felidae/tiger.(*Tiger).Eat in D:\program\goPath\src\bytedance\go-pprof-practi
ce\animal\felidae\tiger\tiger.go
     4.62s      4.62s (flat, cum) 85.08% of Total
         .          .     19:}
         .          .     20:
         .          .     21:func (t *Tiger) Eat() {


         .          .     22:   log.Println(t.Name(), "eat")
         .          .     23:   loop := 10000000000
     4.62s      4.62s     24:   for i := 0; i < loop; i++ {


         .          .     25:           // do nothing
         .          .     26:   }
         .          .     27:}
         .          .     28:
         .          .     29:func (t *Tiger) Drink() {
6.使用web命令来调用关系可视化
注意要使用可视化的话,需要安装 graphviz ,注意下载时将bin目录添加到%PATH%
(pprof) web
二、堆内存
1.查看堆内存性能数据
D:\program\goPath\src\bytedance\go-pprof-practice>go tool pprof -http=:8080 "http://localhost:6060/debug/pprof/heap"
2.在浏览器中进行查看
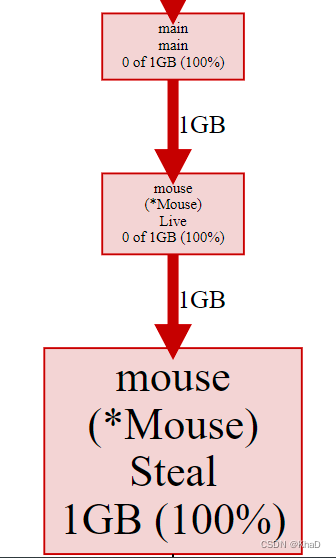
pprof功能概览

下图展现的就是Graph功能
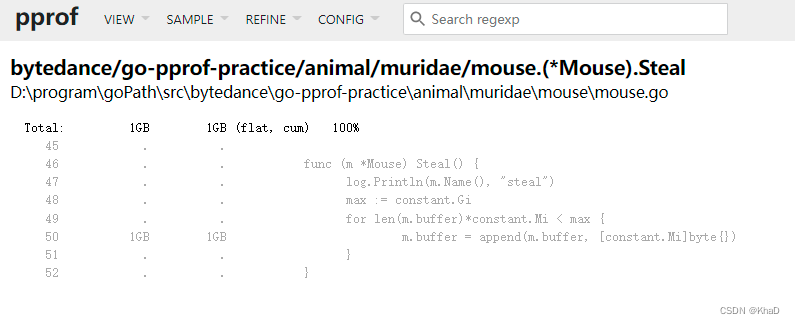
source功能就是显式具体代码。在通过上面查出出现问题的方法后就可以使用source定位到具体代码
三、goroutine
1.查看goroutine性能数据
D:\program\goPath\src\bytedance\go-pprof-practice>go tool pprof -http=:8080 "http://localhost:6060/debug/pprof/goroutine"
四、mutex
1.查看mutex性能数据
D:\program\goPath\src\bytedance\go-pprof-practice>go tool pprof -http=:8080 "http://localhost:6060/debug/pprof/mutex"
五、mutex
1.查看mutex性能数据
D:\program\goPath\src\bytedance\go-pprof-practice>go tool pprof -http=:8080 "http://localhost:6060/debug/pprof/mutex"