前言
pprof是Go程序自带的性能分析工具,prof是profile(画像)的缩写,用于分析go程序的性能。
Profile Descriptions:
-
allocs:
A sampling of all past memory allocations 已分配内存采样 -
block:
Stack traces that led to blocking on synchronization primitives 导致同步原函数阻塞的堆栈追踪 -
cmdline:
The command line invocation of the current program 当前程序的命令调用列表 -
goroutine:
Stack traces of all current goroutines 当前所有goroutines的堆栈追踪 -
heap:
A sampling of memory allocations of live objects. You can specify the gc GET parameter to run GC before taking the heap sample. 存活的对象内存分配采样。你可以指定gc get参数在获取heap样本前运行gc。 -
mutex:
Stack traces of holders of contended mutexes 互斥锁持有着的堆栈追踪 -
profile:
CPU profile. You can specify the duration in the seconds GET parameter. After you get the profile file, use the go tool pprof command to investigate the profile. CPU配置文件。你可以在秒为单位的get参数指定周期,获取配置文件后,使用go tool pprof指令分析配置文件。 -
threadcreate:
Stack traces that led to the creation of new OS threads 导致操作系统线程创建的堆栈追踪 -
trace:
A trace of execution of the current program. You can specify the duration in the seconds GET parameter. After you get the trace file, use the go tool trace command to investigate the trace. 对当前程序的执行情况进行跟踪。你可以在秒为单位的get参数指定周期。获取配置文件后,使用go tool pprof指令分析配置文件。这个非常重要,可以使用trace查看每个栈信息的执行时间,查看耗时情况分析。
使用分析一般常用CPU,内存,线程栈阻塞分析,还有trace。
pprof
pprof实际上就是包引用即可生效,即执行init函数
_ "runtime/pprof"
因为init函数定义了http的pprof的url
func init() {
	http.HandleFunc("/debug/pprof/", Index)
	http.HandleFunc("/debug/pprof/cmdline", Cmdline)
	http.HandleFunc("/debug/pprof/profile", Profile)
	http.HandleFunc("/debug/pprof/symbol", Symbol)
	http.HandleFunc("/debug/pprof/trace", Trace)
}
pprof demo
所以如果开启了http的能力(包括第三方http框架),那么只需要引入包,即可实现pprof能力。
如果没有http呢,此时就需要手动读取信息,写入文件才行,官方demo代码
    //获取cpu profile
   cpuFile, _ := os.OpenFile("cpu.prof", os.O_CREATE|os.O_RDWR, 0644)
   defer cpuFile.Close()
   pprof.StartCPUProfile(cpuFile)
   defer pprof.StopCPUProfile()
   //获取内存profile
   memFile, _ := os.OpenFile("mem.prof", os.O_CREATE|os.O_RDWR, 0644)
   defer memFile.Close()
   pprof.WriteHeapProfile(memFile)
运行后即可写入文件,可根据实际情况编写代码
![]()
如果是http,那么就简单很多了,这里以默认官方http为例,第三方框架有封装,可以根据框架的实际加入pprof。
import (
	"fmt"
	"net/http"
	_ "net/http/pprof" #这个包引入即可,发现低版本的go需要手动引入pprof init函数的路由规则,高版本一般不需要,如果是低版本,可以把init函数的代码复制过来
)

func helloWorld(w http.ResponseWriter, r *http.Request) {
	fmt.Fprintf(w, "hello world!")
	w.Write([]byte("haha......"))
}

func main() {
	http.HandleFunc("/", helloWorld)
	err := http.ListenAndServe(":8080", nil)
	if err != nil {
		fmt.Printf("ListenAndServe: %s", err)
	}
}
pprof分析
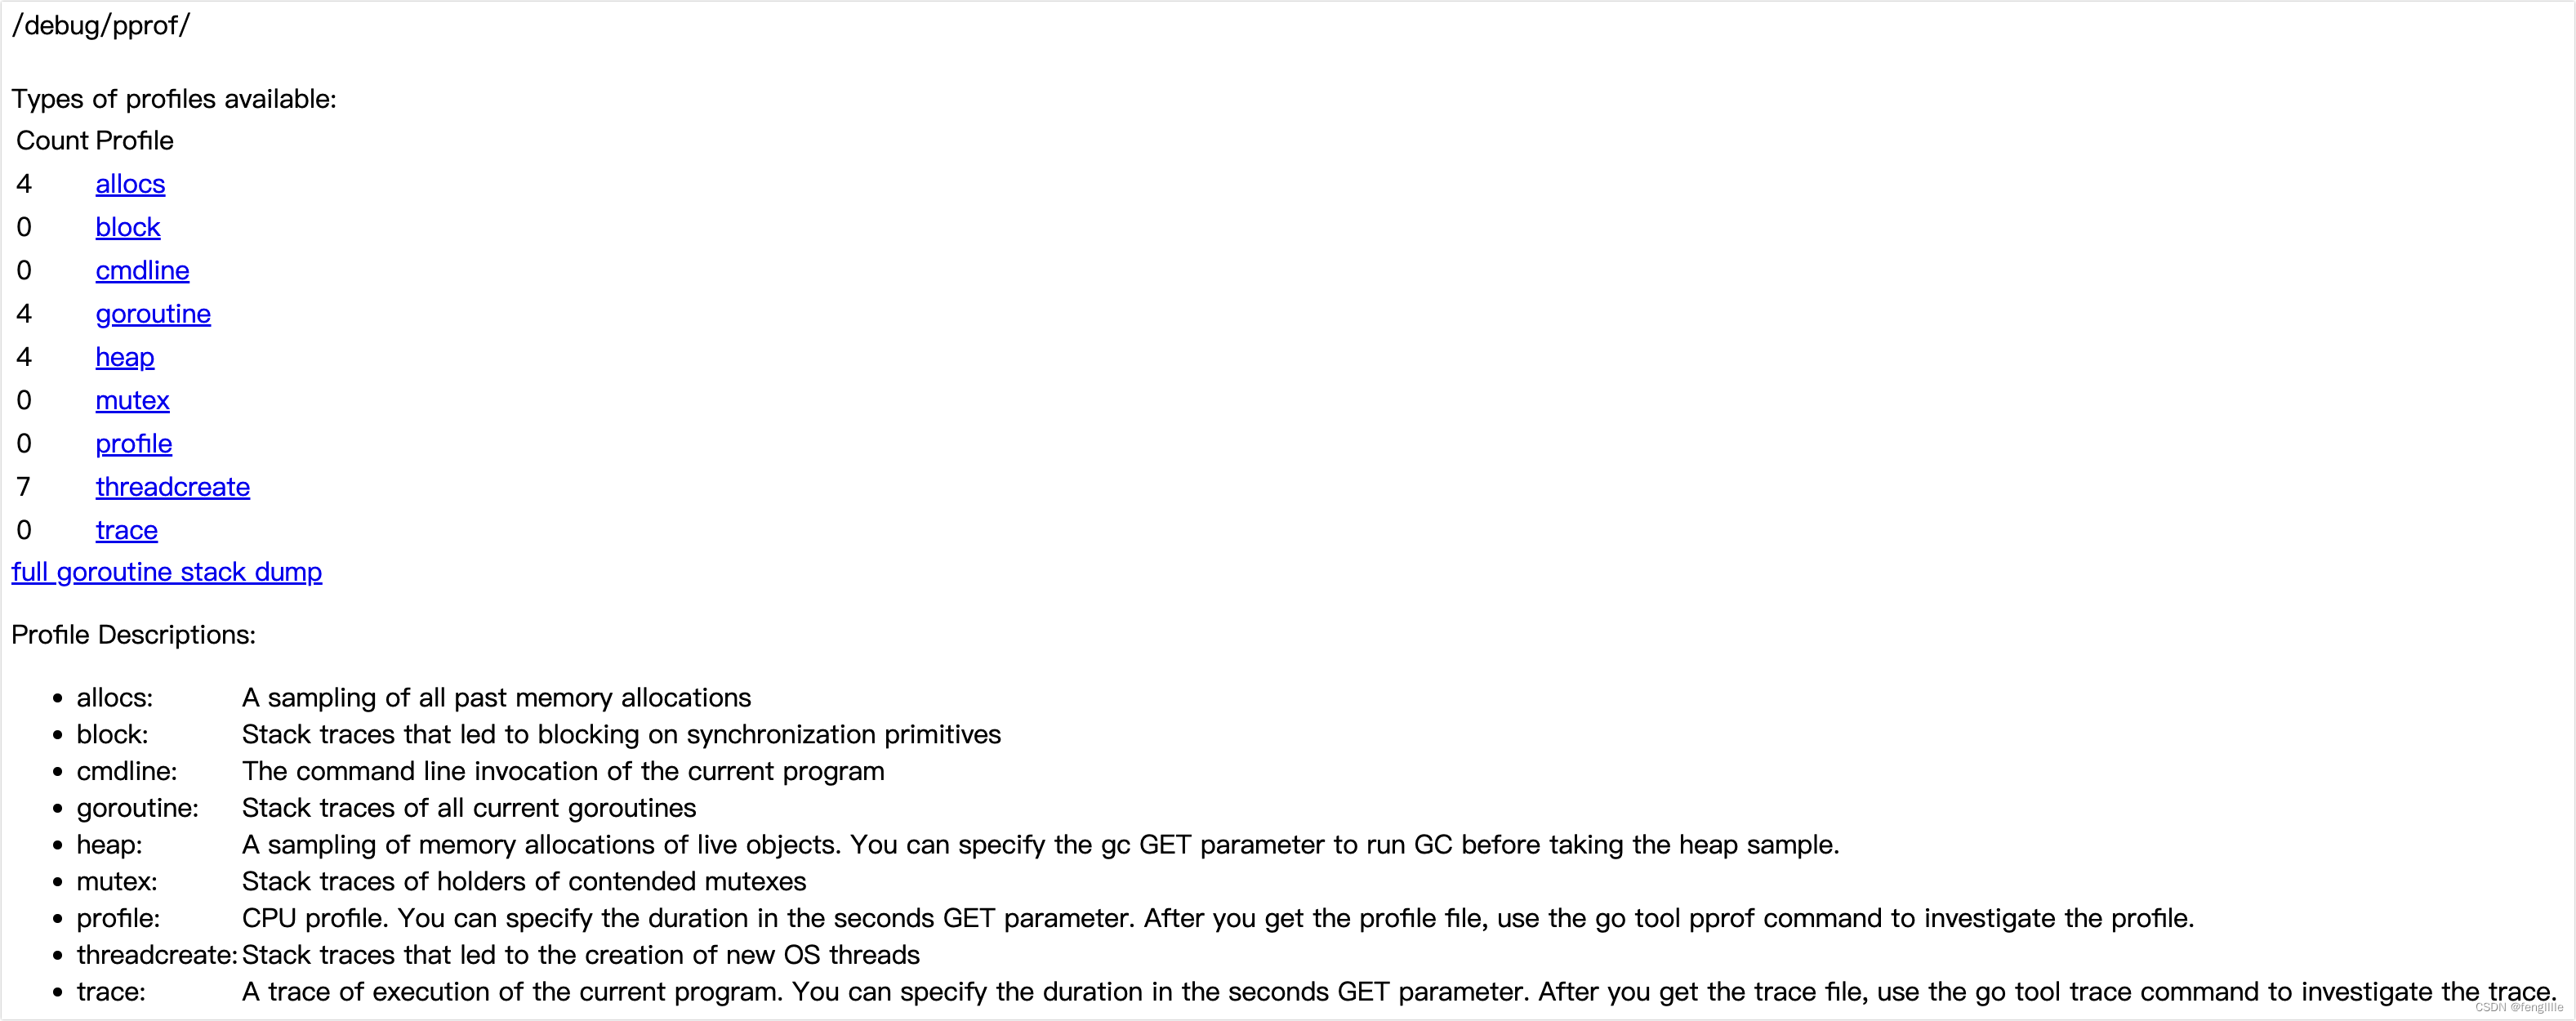
访问http://localhost:8080/debug/pprof/
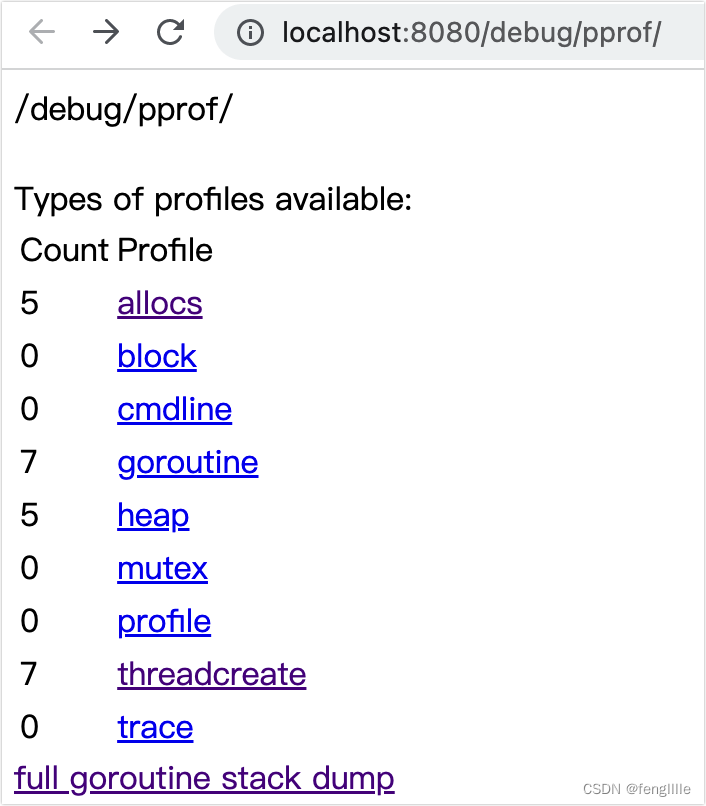
可以直接点击各个链接即可查看,其中full goroutine stack dump
其中这个类似java的jstack,可以看到所有的线程栈。
数据分析通过命令 go tool pprof 进行,可以对文件,即上面demo写的prof文件分析,也可以使用http读取方式实时分析,固定文件方式,可以通过
go tool pprof cpu.prof(xxx.prof)
这种用法适合文件离线分析,一般而言推荐在线分析,因为http在线分析就会生成文件
go tool pprof http://localhost:8080/debug/pprof/profile
此时实际上就连上 /debug/pprof/profile 这个url了,那么分析内容

实际上各个功能都有说明,英文也很简单
![]()
部分功能需要安装特殊的插件才行,MacOS安装如下,其他平台类似,比如yum或者apt等
重构代码,调用看看top线程 占用
func HelloWorld(w http.ResponseWriter, r *http.Request) {
fmt.Fprintf(w, "hello world!")
for i := 0; i < 100000; i++ {
go sayHello(w)
}
}
func sayHello(w http.ResponseWriter) {
fmt.Println("haha.........")
}
func main() {
http.HandleFunc("/hi", HelloWorld)
err := http.ListenAndServe(":8080", nil)
if err != nil {
fmt.Printf("ListenAndServe: %s", err)
}
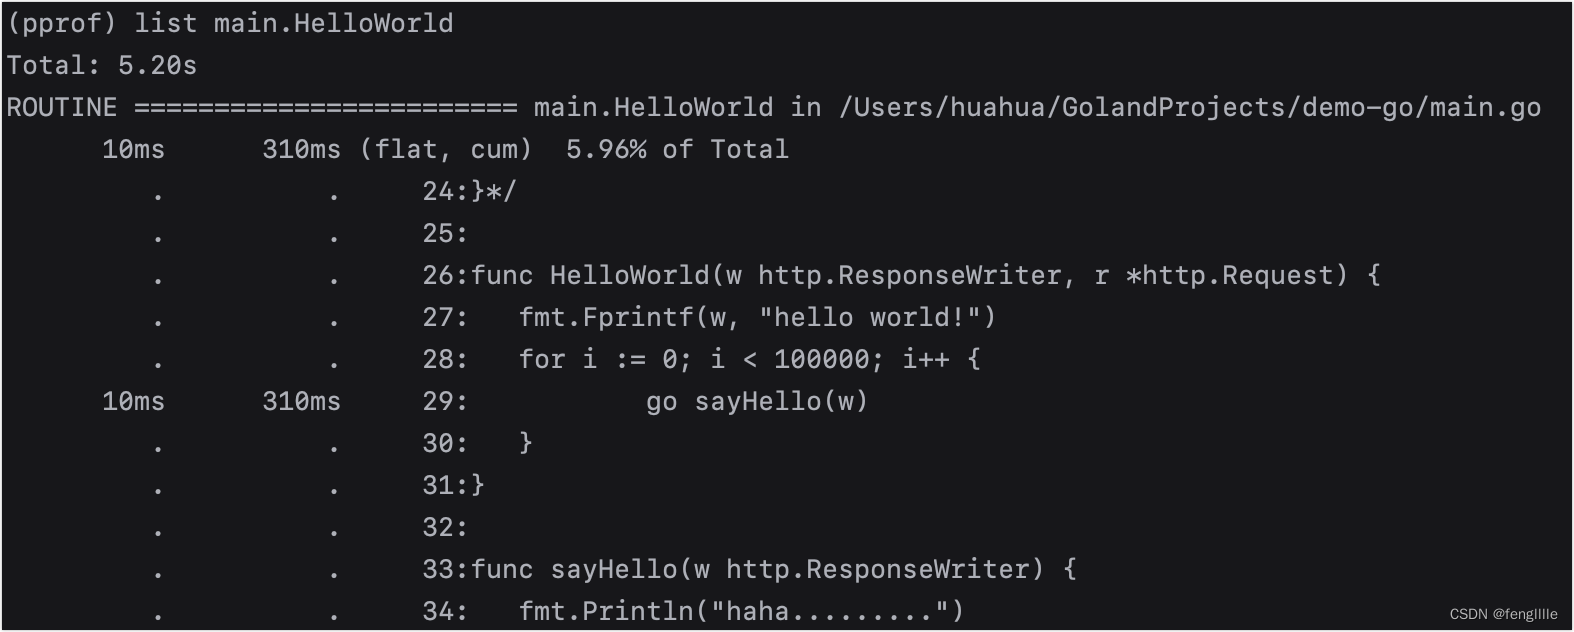
}执行后,通过top 数字,可以看到占用CPU的栈,这里要注意,如果一个函数调用时间较短就可能会看不见,可以多调用几次函数,保证被采样,也可以通过?seconds=xxx设置采样时间。
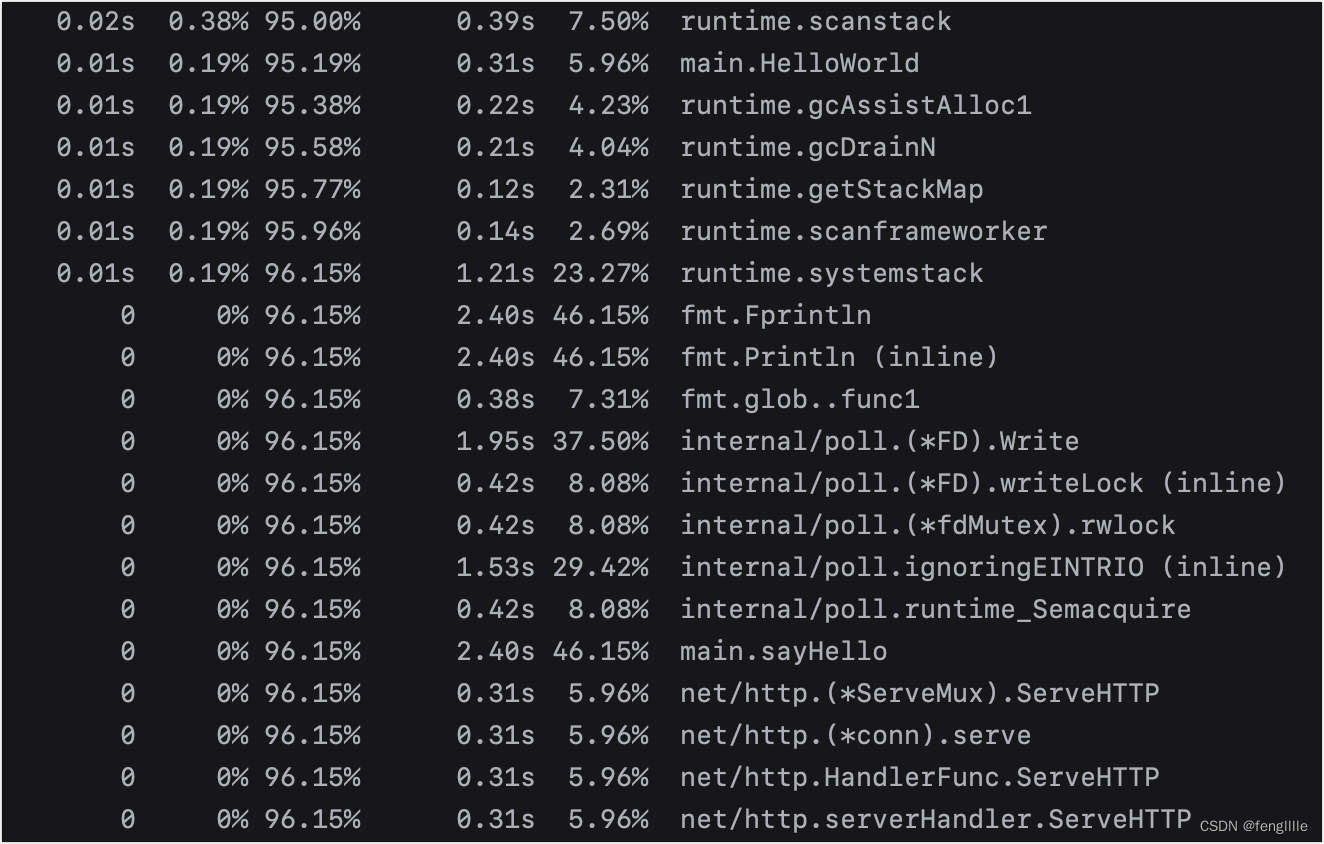
也可以使用list,查看函数执行的占用
输入web,可以看到svg的cpu信息
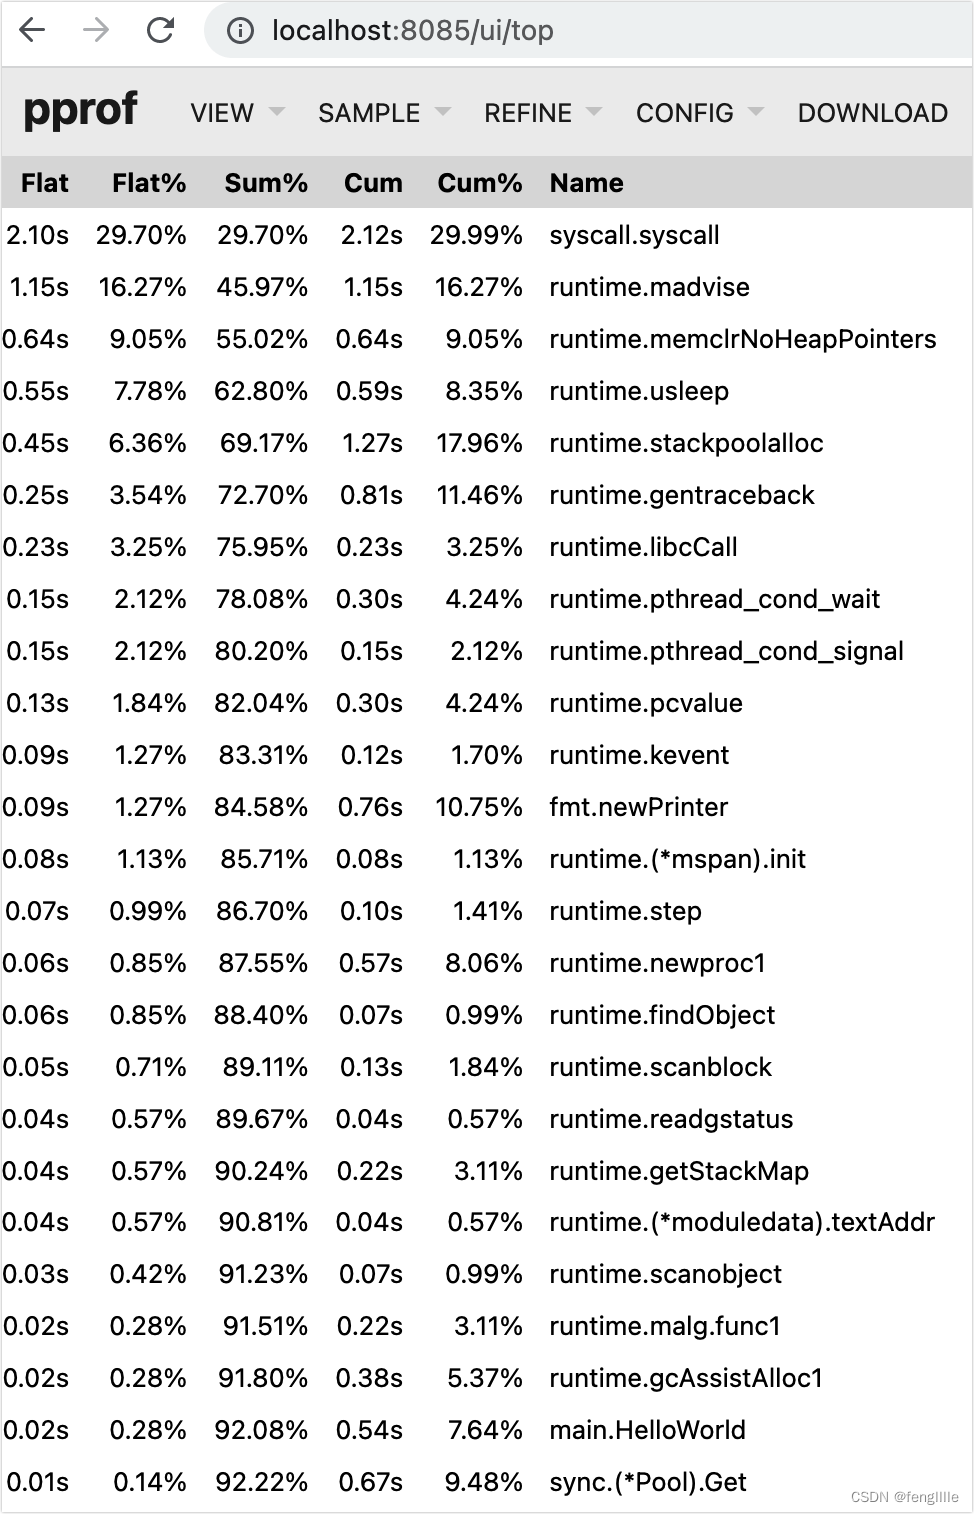
使用go tool pprof -http=":8085" http://localhost:8080/debug/pprof/profile (端口自定义)
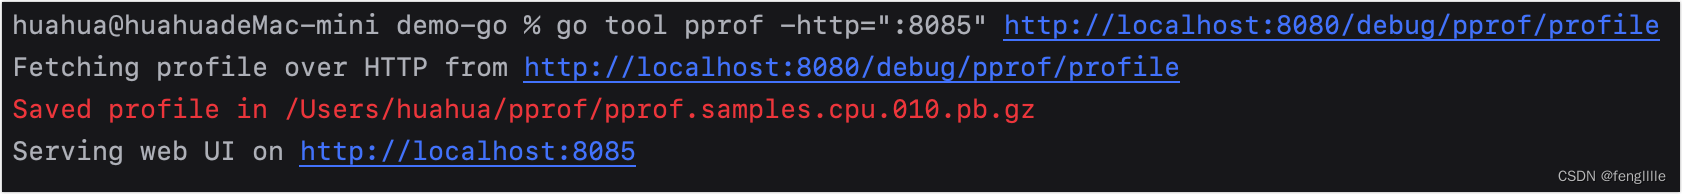
访问如下url:

可以看到top信息
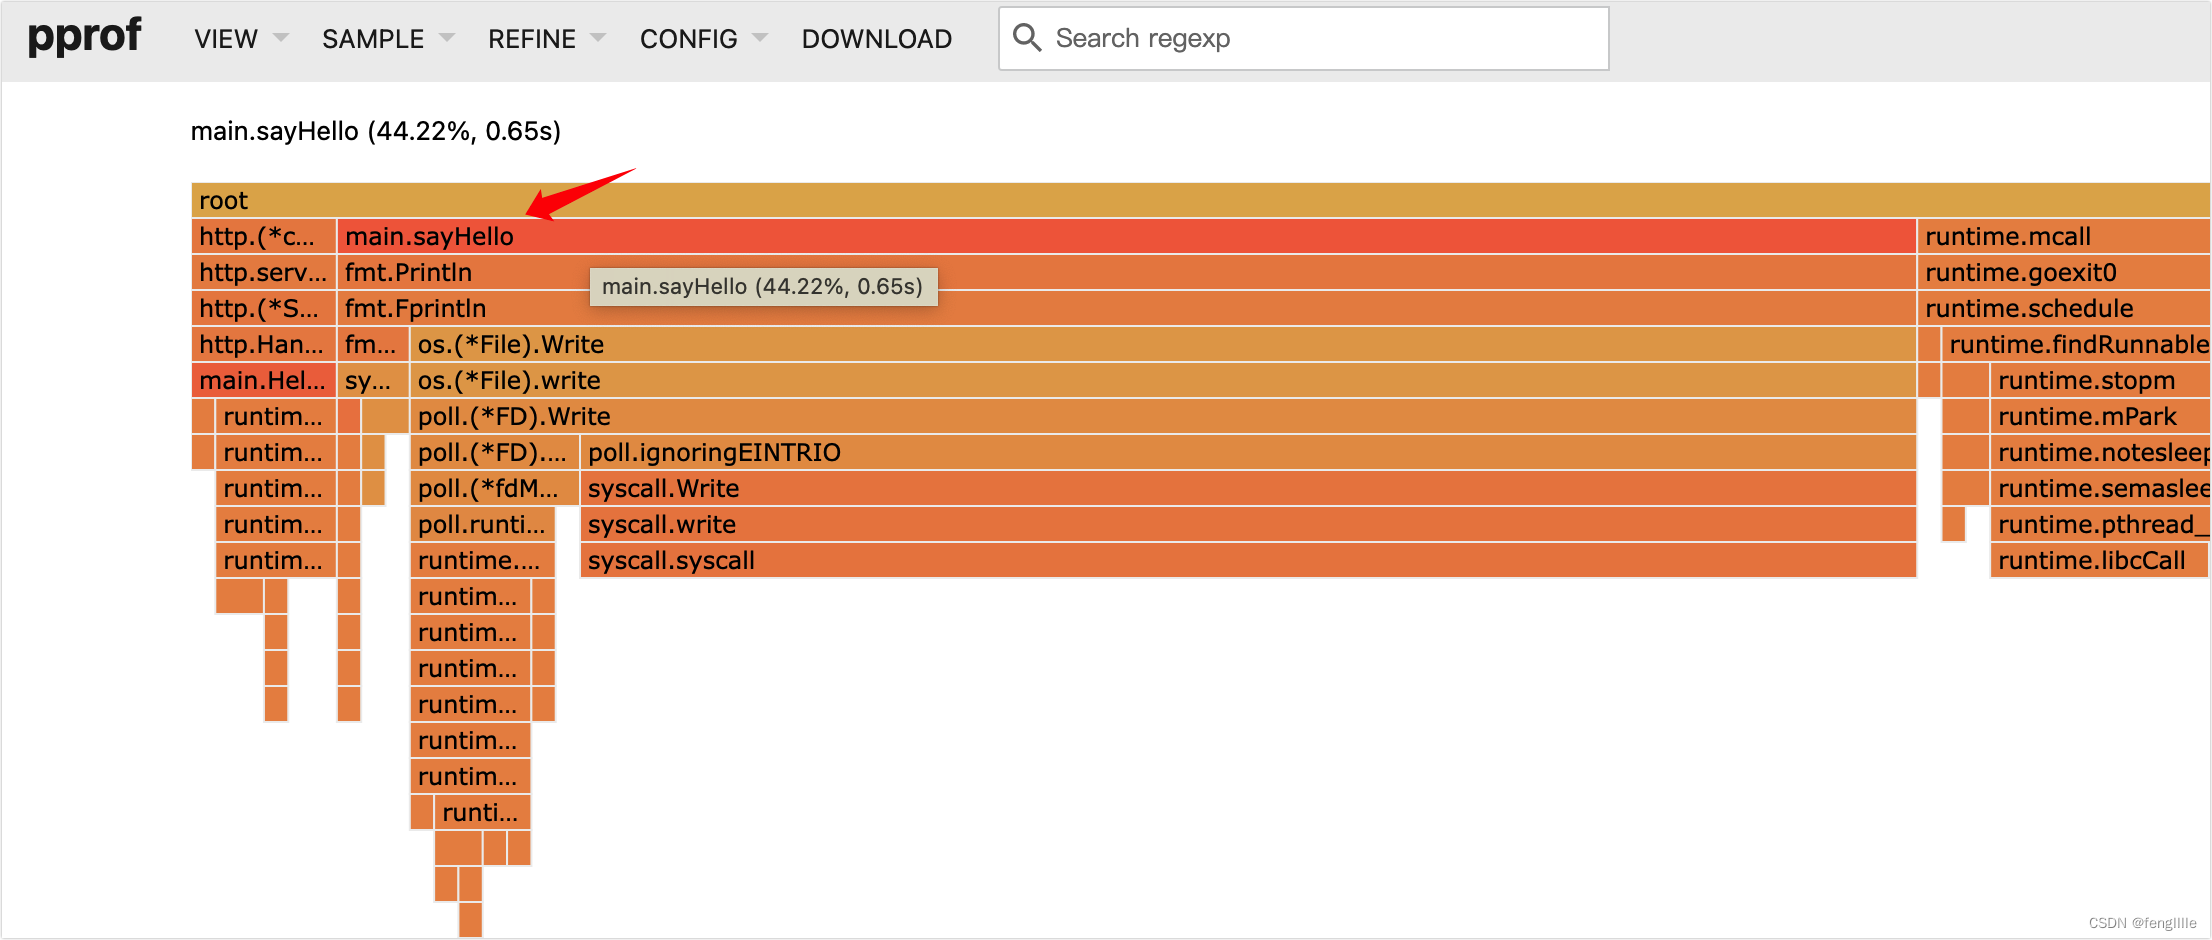
火焰图
实际上上面的信息已经足够分析,不过火焰图是一种常规展示方式,方便最直观的分析,实际上火焰图就在ui图表中
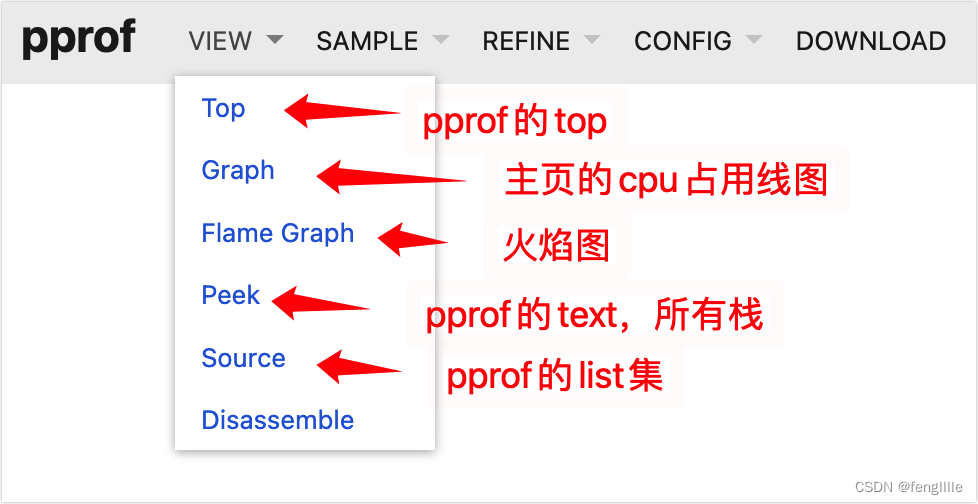
打开火焰图,可以直观的看到demo的示例方法调用时间,占用等信息
trace使用
trace是一个非常重要的功能(也是pprof的一部分,但是需要代码埋点),用于函数和方法的追踪,实际上笔者在前几篇的文章中使用了K8S的封装trace,实际上这个是一个道理,但是内置go的sdk,不需要依赖。
官方示例代码
func main() {
	f, _ := os.Create("trace.out")
	defer f.Close()
	trace.Start(f)
	defer trace.Stop()
  ......
}
改造上面的示例demo
func sayHello(w http.ResponseWriter) {
	r := trace.StartRegion(context.Background(), "HelloWorld")
	defer r.End()
	fmt.Println("haha.........")
}

func main() {
	f, _ := os.Create("trace.out")
	defer f.Close()
	trace.Start(f)
	defer trace.Stop()
	http.HandleFunc("/hi", HelloWorld)
	ctx, task := trace.NewTask(context.Background(), "HelloWorld")
	defer task.End()
	err := http.ListenAndServe(":8080", nil)
	trace.Log(ctx, "http", "http started!")
	if err != nil {
		fmt.Printf("ListenAndServe: %s", err)
	}

	signalChan := make(chan os.Signal, 1)
	signal.Notify(signalChan, os.Interrupt)
	<-signalChan
	fmt.Println("end-----------------")
}
启动应用,然后执行函数,发现
go tool trace trace.out
出现解析报错
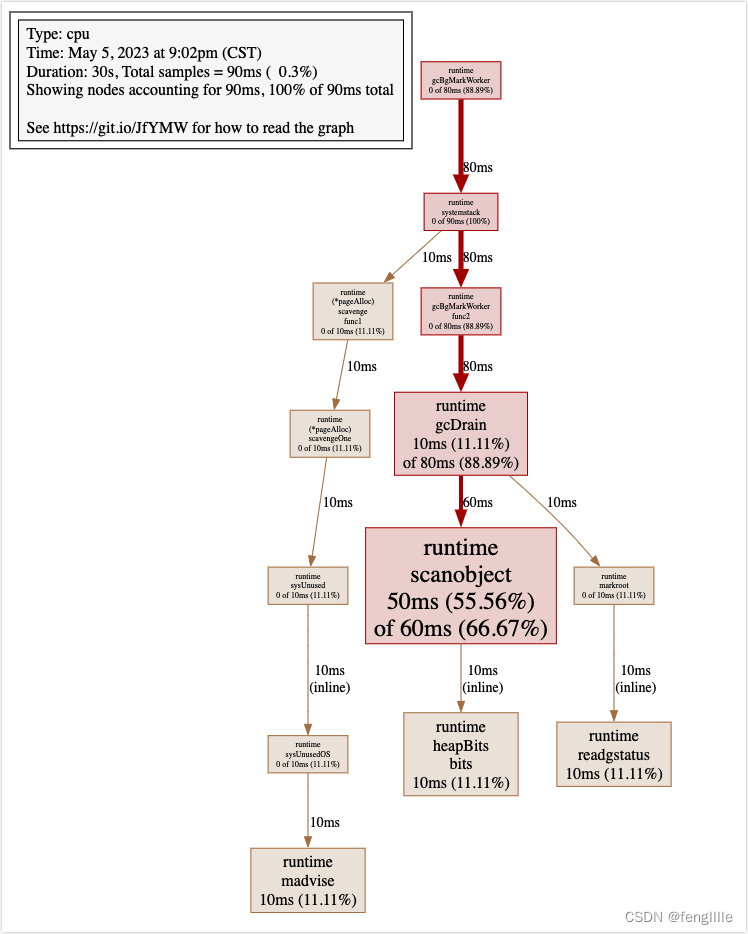
![]()
实际上是trace的stop没执行,trace必须执行stop才能形成完整的trace
继续改造
func main() {
	f, _ := os.Create("trace.out")
	defer f.Close()
	trace.Start(f)
	defer trace.Stop()
	http.HandleFunc("/hi", HelloWorld)
	ctx, task := trace.NewTask(context.Background(), "HelloWorld")
	defer task.End()
	go http.ListenAndServe(":8080", nil)
	trace.Log(ctx, "http", "http started!")

	signalChan := make(chan os.Signal, 1)
	signal.Notify(signalChan, os.Interrupt)
	<-signalChan
	fmt.Println("end-----------------")
}
必须执行stop才行,所以,在demo中需要把进程杀掉 ,实际上也可以自定义stop的地方
然后执行go tool trace trace.out,自动跳出页面,可以看trace埋点,发现函数执行时间,栈的各个函数执行过程
箭头图示就是埋点内容,当然还有其他功能
还发现了trace2,不知道怎么用
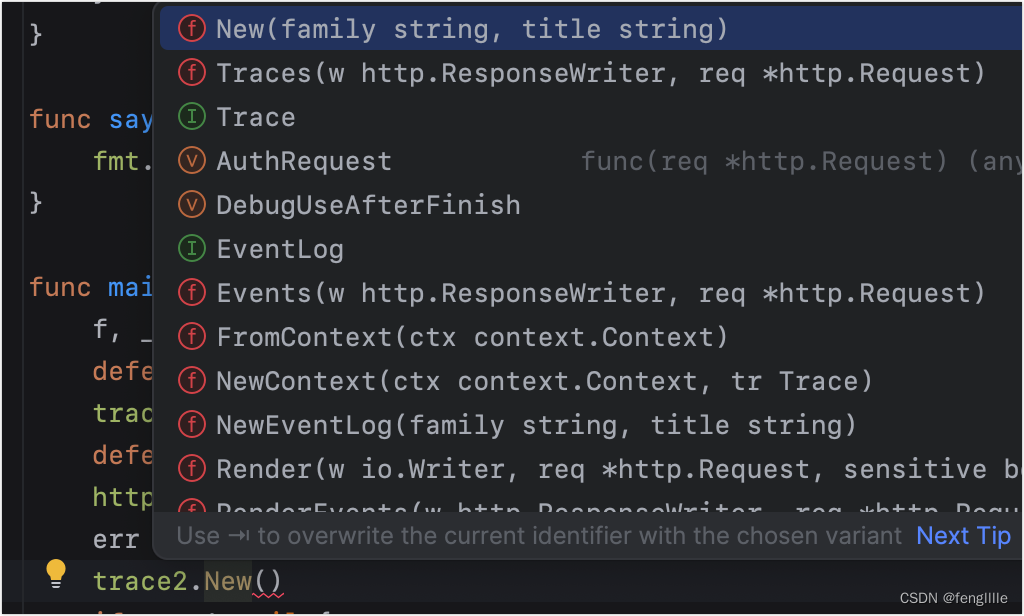
查看源代码,使用方法见代码注释
/*
Package trace implements tracing of requests and long-lived objects.
It exports HTTP interfaces on /debug/requests and /debug/events.
A trace.Trace provides tracing for short-lived objects, usually requests.
A request handler might be implemented like this:
func fooHandler(w http.ResponseWriter, req *http.Request) {
tr := trace.New("mypkg.Foo", req.URL.Path)
defer tr.Finish()
...
tr.LazyPrintf("some event %q happened", str)
...
if err := somethingImportant(); err != nil {
tr.LazyPrintf("somethingImportant failed: %v", err)
tr.SetError()
}
}
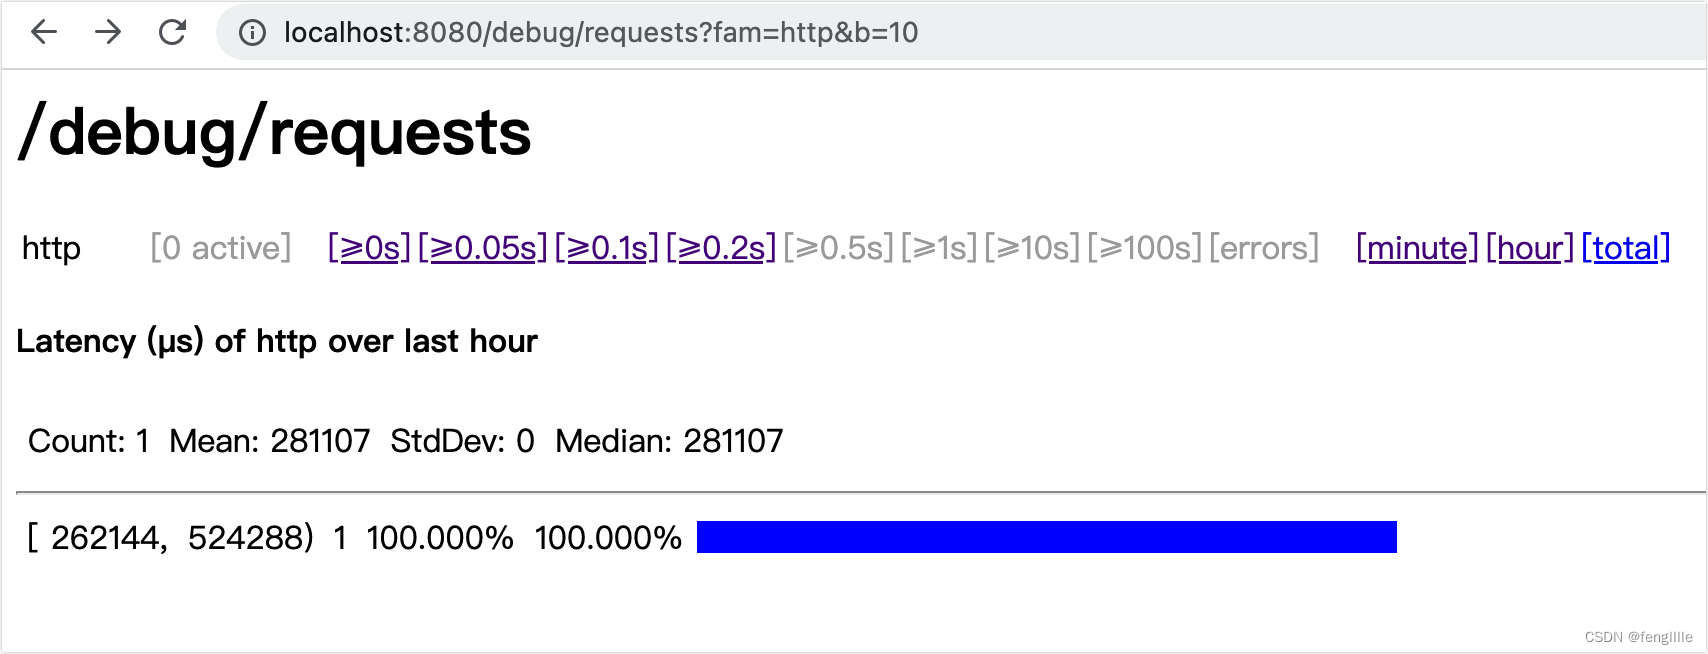
The /debug/requests HTTP endpoint organizes the traces by family,
errors, and duration. It also provides histogram of request duration
for each family.
A trace.EventLog provides tracing for long-lived objects, such as RPC
connections.
// A Fetcher fetches URL paths for a single domain.
type Fetcher struct {
domain string
events trace.EventLog
}
func NewFetcher(domain string) *Fetcher {
return &Fetcher{
domain,
trace.NewEventLog("mypkg.Fetcher", domain),
}
}
func (f *Fetcher) Fetch(path string) (string, error) {
resp, err := http.Get("http://" + f.domain + "/" + path)
if err != nil {
f.events.Errorf("Get(%q) = %v", path, err)
return "", err
}
f.events.Printf("Get(%q) = %s", path, resp.Status)
...
}
func (f *Fetcher) Close() error {
f.events.Finish()
return nil
}
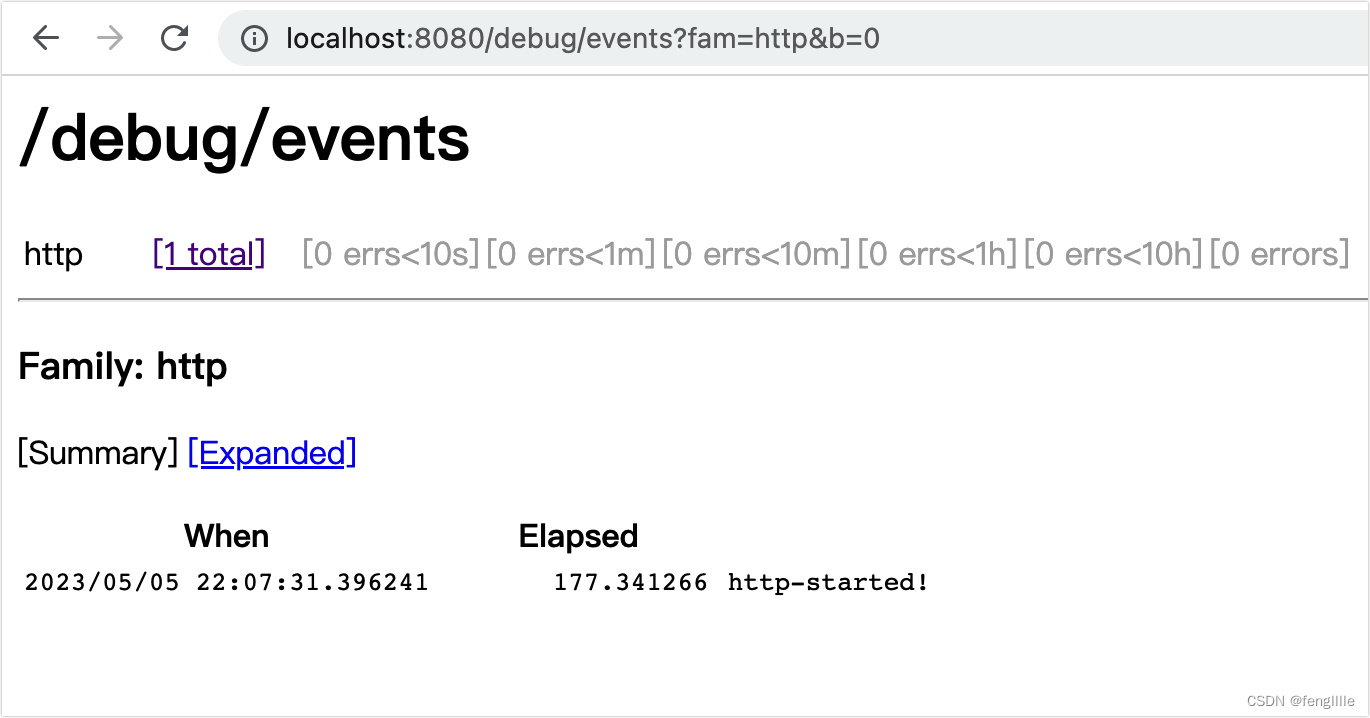
The /debug/events HTTP endpoint organizes the event logs by family and
by time since the last error. The expanded view displays recent log
entries and the log's call stack.
*/
package trace // import "golang.org/x/net/trace"试了一下,跟业务强耦合
func HelloWorld(w http.ResponseWriter, r *http.Request) {
	//trace2.Traces(w, r)
	t := trace2.New("http", "HelloWorld")
	defer t.Finish()
	fmt.Fprintf(w, "hello world!")
	for i := 0; i < 100000; i++ {
		go sayHello(w)
	}
}

func sayHello(w http.ResponseWriter) {
	fmt.Println("haha.........")
}

func main() {

	http.HandleFunc("/hi", HelloWorld)
	go http.ListenAndServe(":8080", nil)
	trace2.NewEventLog("http", "http-started!")

	signalChan := make(chan os.Signal, 1)
	signal.Notify(signalChan, os.Interrupt)
	<-signalChan
	fmt.Println("end-----------------")
}
执行结果,没有trace的能力强大
总结
go语言跟Java类似实际上内置了很多强大的性能分析能力,可以获取go程序执行的方方面面,难道是因为都是gc语言,笔者查询pprof的原理说是gc的stw(stop the world)的过程中处理的,Java实际上有jstack jmap等自带的命令,go直接集成到sdk了,坏处是代码侵入,但是可以精确定位go函数执行的过程,配合webui,尤其是火焰图和trace,基本上大部分问题都可以解决。